| Previous Next Index Image Index Year Selection | |
|
|
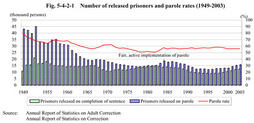
2. Implementation of parole (1) Number of prisoners released on parole and their rate Fig. 5-4-2-1 shows the numbers of prisoners released on completion of their sentence and those released on parole,as well as the parole rates since the Offenders Rehabilitation Law was enforced in1949.
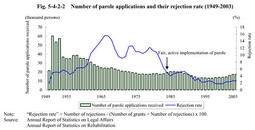
When prisons suffered from overcrowding,immediately after the end of the war,from1949to1952(see Chapter3,Section1 , Fig. 5-3-1-2 ),the parole rate was very high,peaking at79.7%in1949.Thereafter,it also remained high,between65%and70%,until1960. The parole rate fell gradually since the number of prisoners started to decrease in1961after the chaotic postwar period.In1982,it fell to50.8%,the lowest since the current parole system was enforced.Then,the Ministry of Justice implemented a measure for fair,active implementation of parole since1984,in order to improve the function of the parole system as a criminal policy.The measure aims to examine thoroughly whether granting parole is appropriate,and to grant parole to as many prisoners as they meet the requirements and to provide them with the opportunity to rehabilitate themselves.It also aims to extend parole length to ensure necessary period for parole supervision as community-based treatment. As a result,the parole rate remained within the55-58%range without particular fluctuation after an increase to57.6in1984,coming to56.0%in2003. Fig. 5-4-2-1 Number of released prisoners and parole rates(1949-2003) (2) Number of parole applications and rejection rate of parole applications A parole application is filed to a Regional Parole Board by the warden of a prison rather than by a prisoner.When examining a parole application and finding it unsuitable for parole,the Board must,by decision,reject the application.
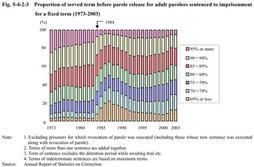
Fig. 5-4-2-2 shows the number of parole applications and their rejection rate since1949.The rejection rate fell to a low level after fluctuating,and has remained within the2-3%range over the last10years. Fig. 5-4-2-2 Number of parole applications and their rejection rate(1949-2003) (3) Proportion of served term before parole Fig. 5-4-2-3 shows the proportion of served sentence term before parole release since1973for adult parolees sentenced to imprisonment for a fixed term.As in the case of the parole rate,it started to change since the Fair,Active Implementation Measure was implemented in1984,and parole came to be granted earlier than before.
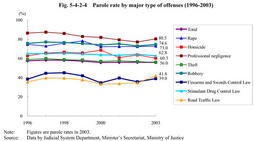
Fig. 5-4-2-3 Proportion of served term before parole release for adult parolees sentenced to imprisonment for a fixed term(1973-2003) (4) Trends in parole by major type o foffense (i) Parolerate Fig. 5-4-2-4 shows the parole rate by major type of offense for prisoners released since statistics became available in1996.
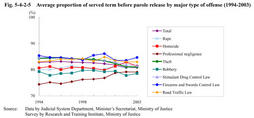
The parole rate is highest for professional negligence,for which almost all cases are related to traffic accidents.Many of those prisoners committing professional negligence do not have an advanced criminal tendency,and their environment factors are well developed to prompt them to return to society.Consequently,their parole rate is the highest.It is also high for robbery and rape,and the rate for homicide is higher than average for all offenses. Examining theft and Stimulant Drug Control Law violations,for both of which the number of prisoners is large,the parole rate for theft is close to the average,since theft accounts for a large part of offenses.The parole rate for Stimulant Drug Control Law violations is somewhat higher than the average. On the other hand,the parole rate is low for violations of the Road Traffic Law and the Firearms and Swords Control Law. Fig. 5-4-2-4 Parole rate by major type of offenses(1996-2003) (ii) Proportion of served term before parole release Fig. 5-4-2-5 shows the average proportion of served term before parole release for all offenses and by type of offense,which is calculated from the data of the137,139parolees(excluding parolees serving life imprisonment sentences)over10years from1994to2003.
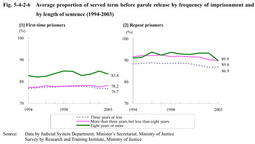
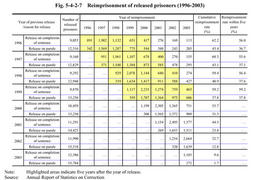
The average served term proportion for all offenses has hovered within the80-83%range without particular fluctuation over the last10years.By type of offense,it has also remained flat for each offense,except slightly increased for professional negligence. The proportion of served term differs somewhat for each offense,but the differences are smaller than those in parole rates.The average proportion of served term for the total10years came to82.2%for all offenses,80.9%for homicide,78.8%for robbery,83.2%for theft,80.6%for rape,76.7%for professional negligence,84.6%for Firearms and Swords Control Law violations,83.5%for Stimulant Drug Control Law violations,and83.5%for Road Traffic Law violations. The proportion of served term certainly differs for individual prisoners who committed the same crime.The standard deviation for such differences over the total10years is9.2for all offenses,9.7for homicide,10.2for robbery,9.1for theft,8.7for rape,8.3for professional negligence,8.7for Firearms and Swords Control Law violations,8.7for Stimulant Drug Control Law violations,and9.2for Road Traffic Law violations. Fig. 5-4-2-5Average proportion of served term before parole release by major type of offense(1994-2003) Fig. 5-4-2-6 Average proportion of served term before parole release by frequency of imprisonment and by length of sentence(1994-2003) (5) Reimprisonment of adult parolees Fig. 5-4-2-7 shows the number of prisoners released but reimprisoned each year since statistical data became available in1996.
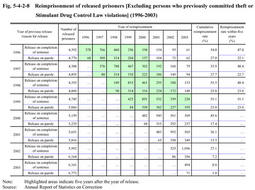
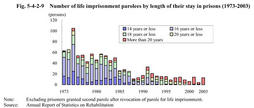
The five years reimprisoned rate was within56-59%for prisoners released on completion of their sentence,while around37%for those released on parole.The large gap of about20%between the two indicates that decision granting parole has been relatively appropriate. Each country has different treatment programs for released prisoners,which makes it difficult to compare the reimprisonment rate among countries.However,in order to identify general trends in other countries,we now examine the data of the United Kingdom(limited to England and Wales),for which recent statistical data was available.In U.K.,the two years prisoners reimprisoned rate was36%for male prisoners(64,543)released in1999,and31%for female prisoners(5,041)released in that year(Source:Prison Statistics England and Wales2002).Meanwhile,in Japan,the corresponding rate was24.1%(34.2%for those released completing their sentences and16.2%for those paroled)for males,and10.9%(23.5%for those released on completion of their sentences and7.9%for those paroled)for females(Source:Annual Report of Statistics on Correction). Fig. 5-4-2-7 Reimprisonment of released prisoners(1996-2003) Fig. 5-4-2-8 Reimprisonment of released prisoners[Excluding persons who previously committed theft or Stimulant Drug Control Law violations](1996-2003) (6) Parole of life imprisonment prisoners Fig. 5-4-2-9 shows the number of parole released prisoners serving life imprisonment sentences since1973,by length of their stay in prisons.Parole of life imprisonment prisoners has been granted very cautiously in recent years.
The number of life imprisonment parolees has been declining for a long time.More than50of those prisoners were granted parole every year until1984,but an average of9.2prisoners have been paroled over the last five years.Also,their stay in prisons has become longer before parole.More than half of those parolees stayed in prisons for16years or less in the Showa era,but41or89.1%of46parolees have stayed for more than20years over the last five years. Fig. 5-4-2-9 Number of life imprisonment parolees by length of their stay in prisons(1973-2003) (7) Intermediate conclusion As overviewed the implementation of parole in Japan,in recent years,the parole rate remained between55and59%,and the average proportion of served term before parole release for fixed-term prisoners stayed between80and83%,both showing no major changes.
More specifically,the parole rate varies considerably in offenses,while the served term proportion shows no large differences between offenses.The served term proportion has been influenced by parolees'criminal history and the seriousness of their offenses(length of sentence).Parole has been granted very cautiously to life imprisonment prisoners in recent years,which also suggests that the seriousness of offenses has been more considered in granting parole. The five year reimprisoned rate of released prisoners has been significantly lower for parolees than prisoners released on completion of their sentences.For those prisoners who committed offenses other than theft and Stimulant Drug offenses,in particular,that rate for parolees was less than one-quarter of the rate for non-paroled prisoners. Thus,parole examinations have been implemented appropriately in Japan as a whole.They have been supported by the efforts to enhance appropriate parole examinations and by the measures for effective parole supervision such as intermediate treatment of long-term parolees.The following section gives an overview of these efforts to support the administration of parole and other measures. |