| Previous Next Index Image Index Year Selection | |
|
|
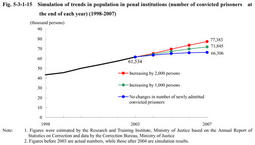
5. Simulation of trends in population in penal institutions The Research and Training Institute of the Ministry of Justice has conducted a simulation to predict future trends in population of convicted prisoners.Assuming that there are no changes in"distribution of terms of imprisonment of newly admitted prisoners,""parole rate"and"rate of term served by prisoners granted parole,"we calculated changes in the number of convicted prisoners at the end of each year between2004and2007under three scenarios:(1)number of newly admitted prisoners remaining at the same level as in2003;(2)number of newly admitted prisoners increases by1,000persons per year and(3)number of newly admitted prisoners increases by2,000persons per year(for details of the calculation method,see the column).
Fig. 5-3-1-15 shows the results.The number of convicted prisoners at the end of2007was estimated as(1)66,306if the number of newly admitted prisoners does not increase,(2)71,845if it increases by1,000persons per year and(3)77,383if it increases by2,000persons per year. Fig. 5-3-1-15Simulation of trends in population in penal institutions(number of convicted prisoners at the end of each year)(1998-2007) Furthermore,we should note that this simulation is based on the assumption that there will be no changes in the distribution of sentences for newly admitted prisoners.In fact,however,the sentencing of newly admitted prisoners tends to be longer imprisonment in recent years(see Fig. 5-3-2-6 and Section4in this chapter).Taking this tendency into consideration,the number of inmates would become even greater than the results of the above calculation. In reviewing the trends in population in overall penal institutions,consideration should be given not only to the trend of convicted prisoners mentioned above but also to that of inmates awaiting trial.The average daily number of inmates awaiting trial was11,323in2001,11,694in2002and12,052in2003.This indicates an increase for every year(see Appendix2-5 ).The number of persons requested for detention,which has an influence on the number of inmates awaiting trial,also continues to increase,coming to121,696in2001,129,345in2002and138,900in2003(Source:Annual Report of Statistics on Prosecution). Column Calculation Method for Trends in Population in Penal Institutions 1.Basic concept The calculations were done in the following three categories:(1)release situation of existing prisoners(how long will it take for existing prisoners to be released on serving their sentences and inmate population decreases);(2)number of future newly admitted prisoners(how many prisoners will be newly admitted)and(3)release situation of future newly admitted prisoners(how long will it take for future newly admitted prisoners to be released by serving their sentences and inmate population decreases).Each category is based on the following concepts or assumptions. 2.Release situation of existing prisoners (1) In order to estimate release of existing prisoners,we needed to calculate the decreasing in prisoners each year(b)from the number of convicted prisoners at the base point in time(a). Prisoners have different lengths of imprisonment term.Some are released on completion of their sentences while others are released on parole.Furthermore,the rate of term served by those prisoners granted parole may differ depending on their sentenced term.Therefore,to calculate(b),we needed to grasp the distribution of length of the sentenced terms at the base point in time(c)and multiply it by the according rate of term served(d)(Calculation was conducted on the assumption that the rate of term served for those prisoners released upon completion of their sentence is100%.). (2) This simulation adopted the yearend of2003as its base point in time and used the number of prisoners as of the end of2003as the standard value of(a). (3) We used the distribution of served term among inmates on May10,2004.The data were obtained from the Correction Bureau,Ministry of Justice,as the closest figures to assume the distribution of served term among inmates at the base point in time,the yearend of2003(c). Here,"served term"refers to the number of days obtained by subtracting the total days of pre-conviction detention etc.from the term sentenced by the courts.Since the term inmates actually serve is the served term and not the sentenced term,the former term should be used for the calculation.However,because the Annual Report of Statistics on Correction keeps the yearend data of the imprisonment terms of inmates by their sentenced term,we researched the served term of all inmates on May10,2004,assuming that the date is relatively close enough to infer the distribution of served term at the base point in time. (4) As the rate of term served for each length of term served(d),we used the actual distribution of all released inmates in the last three years(from2001to2003),data by Judicial System and Research Department,Minister's Secretariat,Ministry of Justice. 3.Future newly admitted prisoners As for the number of future newly admitted prisoners,we used three figures under the following assumptions:"maintaining the level of2003,""increasing from the level of2003by1,000persons per year"and"increasing by2,000persons per year." 4.Release of future newly admitted prisoners (1) In order to make the assumption of the release of future newly admitted prisoners,we needed to determine the distribution of their served terms(e)and calculate how many of them will be released each year based on the rate of term served(f). (2) The problem is how to determine the distribution of served terms for newly admitted prisoners(the data for newly admitted prisoners in the Annual Report of Statistics on Correction is not appropriate to use because it is not the served term but the sentenced term). "The distribution of served terms for newly admitted prisoners in recent years"was estimated through a statistical method.The distribution of served terms for existing prisoners at a certain point of time is the year-to-year accumulation of the distribution of served terms for newly admitted prisoners.Therefore,we calculated"the distribution of served terms for newly admitted prisoners in recent years"retrospectively based on the distribution of served terms for all convicted inmates as of May10,2004,which was determined as in2(3)above(the number of inmates at the yearend of last five years(from1999to2003)was optimized by the least-squares method).After that,this distribution was used as the distribution of served terms for newly admitted prisoners between1999and2003,assuming that there are no changes in this distribution for several years. (3) We assumed the rate of term served for each served terms as checked in2(4)above would not change for several years and used the rate to obtain the rate of term served(f)for newly admitted prisoners. 5.Calculation of inmates at the end of each year The number of convicted prisoners at the end of each year was calculated by totaling the number of existing prisoners and the number of newly admitted prisoners at the end of each year obtained by the method described above. The number of prisoners at the end of each year includes a small number of fine defaulters in workhouses.However,they are all considered to be convicted prisoners in order to simplify the calculation. |