| Previous Next Index Image Index Year Selection | |
|
|
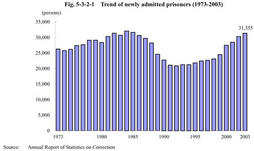
1. Trends in newly a dmitted prisoners (1) Number Fig. 5-3-2-1 shows the number of newly admitted prisoners since1973.The number of newly admitted prisoners has continued to increase since1993,and has increased significantly by1,000to3,000annually in the last five years in particular.In2003it was31,355,the fourth largest since1973,following1984,1985,and1982.
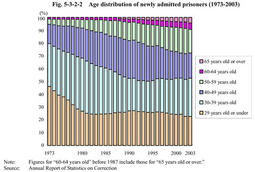
Fig. 5-3-2-1 Trend of newly admitted prisoners(1973-2003) (2) Age Fig. 5-3-2-2 shows the age distribution of newly admitted prisoners since1973,from which an aging trend can be clearly observed.The under30age group showed a sharp decline from1973to the beginning of the1980s,while the fifties and sixties and over age groups continued to increase until quite recently.The percentage of those under30decreased from46.1%in1973to22.6%in2003.In contrast,the percentage of those aged sixty or over increased from1.3%in1973to9.3%in2003(the percentage of those aged sixty five or over was4.3%in2003).
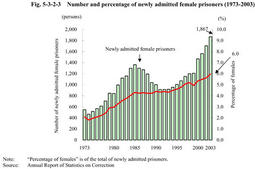
Fig. 5-3-2-2 Age distribution of newly admitted prisoners(1973-2003) (3) Gender Fig. 5-3-2-3 shows the number and percentage of newly admitted female prisoners since1973.The number of newly admitted female prisoners in2003was1,867,and its percentage was6.0%.The female percentage has been consistently on an upward trend.
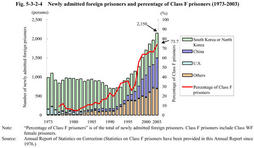
Fig. 5-3-2-3 Number and percentage of newly admitted female prisoners(1973-2003) (4) Nationalities and regions Fig. 5-3-2-4 shows the number of newly admitted foreign prisoners by nationality and regions since1973and the percentage of Class F prisoners(foreign nationals who need different treatment program from those for Japanese)among them.Until1980,most of foreign prisoners were South or North Korean nationals living in Japan.The percentage of Class F prisoners was very low in those days,and there were few problems observed.
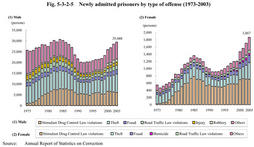
The percentage of Class F prisoners showed a sharp increase in line with an increase of"Others"in Fig. 5-3-2-4 since around1992.This coincides with the time when the cleared cases of non-traffic penal code offenses committed by visiting foreign nationals exceeded that by other foreign nationals(see Fig. 1-2-2-2 ),which indicates that"the problem of visiting foreign nationals"became serious in criminal policy in around1992. The number of newly admitted foreign prisoners in2003was2,150,including1,534Class F prisoners(73.7%).Their nationalities and regions were more than40in2003,and the nationalities and regions of Class F prisoners who were in penal institutions at the end of 2003 numbered more than70(Source:Annual Report of Statistics on Correction,and Data by Judicial System and Research Department,Minister's Secretariat,Ministry of Justice).In Fig. 5-3-2-4,nationalities and regions are classified only into"South Korea or North Korea,""China,""U.S.,"and"Others,"because the Annual Report of Statistics on Correction before1994had only those four categories. Fig. 5-3-2-4 Newly admitted foreign prisoners and percentage of Class F prisoners(1973-2003) (5) Types of offense Fig. 5-3-2-5 shows the number of newly admitted prisoners by type of offense since1973,comparing males and females.In recent years,the number of those convicted for theft and Stimulant Drug Control Law violations has been large in both genders,accounting for around50%in male new prisoners and more than60%in female new prisoners.Compared to1973,Stimulant Drug Control Law violations have increased significantly in both genders.
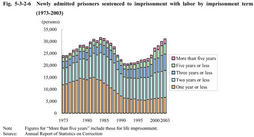
Fig. 5-3-2-5N ewly admitted prisoners by type of offense(1973-2003) (6) Term of imprisonment Fig. 5-3-2-6 shows the number of newly admitted prisoners sentenced to imprisonment with labor by imprisonment term since1973.Those sentenced to imprisonment one year or less decreased since the beginning of the1980s.Then,those sentenced to longer imprisonment started to increase,and the imprisonment term has become longer as a whole.
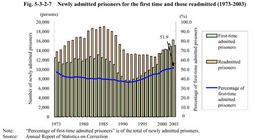
Fig. 5-3-2-6 Newly admitted prisoners sentenced to imprisonment with labor by imprisonment term(1973-2003) (7) Frequency of imprisonment Fig. 5-3-2-7 shows the number of first-time admitted prisoners and readmitted prisoners,and the percentage of first-time admitted prisoners since1973.
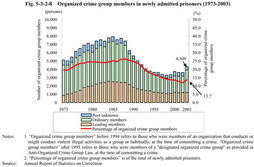
Through1975and1985,when the total of newly admitted prisoners increased,first-time admitted prisoners were leveling off,and readmitted prisoners increased.In contrast,both have been increasing in recent years,and the increase is particularly significant in first-time prisoners.Its percentage has been on an upward trend since the beginning of the Heisei Era,exceeding50%in2001and reaching51.9%in2003.The recent increase of first-time prisoners,for whom correctional treatment can expect better results,makes it more important to focus on treatment aiming at their rehabilitation. Fig. 5-3-2-7 Newly admitted prisoners for the first time and those readmitted(1973-2003) (8) Prisoners related to organized crime groups Fig. 5-3-2-8 shows the number and percentage of organized crime group members in newly admitted prisoners since1973.The percentage of organized crime group members had been around25%from1977to1991,and has declined since1992,falling to13.7%(4,309persons)in2003.
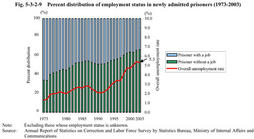
Fig. 5-3-2-8 Organized crime group members in newly admitted prisoners(1973-2003) (9) Employment Fig. 5-3-2-9 shows the percent distribution by employment status of newly admitted prisoners and the overall unemployment rate since1973.The unemployment rate of newly admitted prisoners has been on an upward trend and was66.8%(20,928persons)in2003.Unemployment rates in society and in new prisoners have shown similar trends.
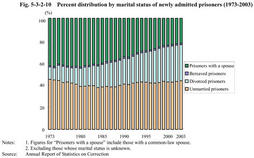
Fig. 5-3-2-9 Percent distribution of employment status in newly admitted prisoners(1973-2003) (10) Marital status Fig. 5-3-2-10 shows the percent distribution by marital status of newly admitted prisoners since1973.The rate of unmarried prisoners has shown no significant changes,while that of divorced prisoners has been on an upward trend,which has resulted in a decrease in the percentage of prisoners with a spouse over the long term,from42.6%in1973to22.7%in2003.
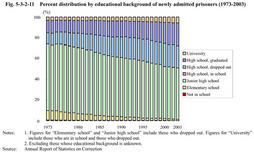
Fig. 5-3-2-10 Percent distribution by marital status of newly admitted prisoners(1973-2003) (11) Educational background Fig. 5-3-2-11 shows the percent distribution by educational background of newly admitted prisoners since1973.The tendency of higher education can be observed statistically,with a decline of"junior high school"percentage and an upward trend of"high school"and"university"percentages.
Fig. 5-3-2-11 Percent distribution by educational background of newly admitted prisoners(1973-2003) (12) Intermediate summary So far,we have overviewed the changes in newly admitted prisoners from the peaceful era of1973to date.Changes are characterized by increases of elderly prisoners,foreign prisoners with a wide range of nationalities,prisoners convicted for stimulant drug offenses,female prisoners and first-time admitted prisoners.In recent years,prisoners have not only increased in number,but have shown qualitative changes.In the following parts,detailed considerations will be given to elderly prisoners,foreign prisoners and those convicted for stimulant drug offenses,whose significant increases pose various challenges for their correctional treatment.
|
