| Previous Next Index Image Index Year Selection | |
|
|
4. Background cause of prison overcrowding Until now,we have outlined the current situation of overcrowded prisons.This subsection considers the background cause of such situation.The size of the prison population basically depends on the crime situation and court sentencing decisions.The following is an overview of the trend of accommodation in penal institutions and the crime situation,followed by the trend of sentencing by courts.
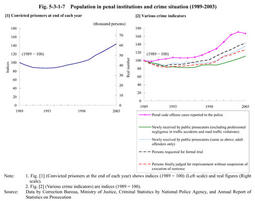
(1) Trend of accommodation in penal institutions and crime situation Fig. 5-3-1-7 shows the trend of accommodation in penal institutions and the crime situation since1989. Fig. 5-3-1-7[1] shows the trend of the number of convicted prisoners at the end of each year,assuming the figure for1989as100for index purposes. Fig. 5-3-1-7[2] shows the trend of various criminal indicators,assuming the figure for1989as100for index purposes.
The number of convicted prisoners at the end of each year had decreased from1989to1991,had remained at a low level from1991to1994and has started to increase significantly since1995. The number of Penal Code offenses reported to the police has been on an upward trend showing significant increase from1996.The number of newly received cases by public prosecutors(excluding professional negligence in traffic accidents and road traffic violation)showed decreases and signs of leveling off at the beginning of the Heisei Era(Heisei Era is the period from January8,1989to the present)and has increased significantly since1997.Limiting the focus to the number to adult offenders,it hit bottom in1992and has increased since.The number of persons requested for formal trial and the number of persons finally judged for imprisonment without suspension of execution of sentence,which are closely related to the trend of accommodation of penal institutions,also showed a decrease or leveled off at the beginning of the Heisei Era but started to increase since around1993.This increase has been particularly significant since1999. As mentioned above,the society was safe and secure and the number of convicted prisoners remained at a low level during the period from the end of the Showa Era(Showa Era is the period from1926to1989.)to the beginning of the Heisei Era.However,the crime situation has worsened since then and the number of cases deemed appropriate for formal trial or imprisonment without suspension of execution of sentence has increased.These changes seem to be the cause of the recent increase in the number of convicted prisoners and the occupancy rate of capacity. Fig. 5-3-1-7Population in penal institutions and crime situation(1989-2003) (2) Longer term of imprisonment Population in penal institutions depends not only on the number of crimes and convicted prisoners but also on court sentencing.Looking at the overall trend of court sentencing since1973,the term of imprisonment has become longer,as follows.
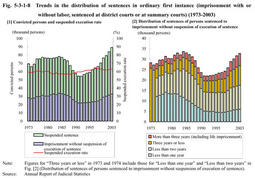
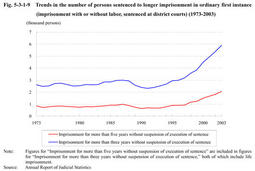
Fig. 5-3-1-8[1] shows the trends in the number of persons convicted in the ordinary first instance(imprisonment with or without labor,sentenced at a district court or at a summary court)and the rate of suspending the execution of sentence. Fig. 5-3-1-8[2] shows the number and the distribution of sentences of persons who were sentenced to imprisonment without suspension of execution of sentence. The suspended execution rate has shown no major changes,remaining at around60%or rather,it has been comparatively higher since1993.Yet since the total number of convicted persons has increased,the number of persons who were sentenced to imprisonment without suspension of execution of sentence also has increased since1993especially significantly since1999.Looking at the trend in the distribution of sentenced length of imprisonment without suspension of execution of sentence in Fig. 5-3-1-8[2] ,it is obvious that imprisonment for more than three years has increased recently while shorter imprisonment for less than one year has decreased,indicating that the courts are sentencing longer imprisonment terms compared to1973. Fig. 5-3-1-9 shows the changes in the number of persons sentenced to longer imprisonment for more than three years or for more than five years(both including life imprisonment).The number once decreased at the beginning of the Heisei Era but returned to the level of the end of the Showa Era around1995and1996.The number has increased continuously ever since. The number of newly admitted prisoners in2003was31,355and is approximately the same as the31,397prisoners of1982(Source:Annual Report of Statistics on Correction).However,the larger number of persons who were sentenced to longer imprisonment places a heavier burden on penal institutions. Fig. 5-3-1-8Trends in the distribution of sentences in ordinary first instance(imprisonment with or without labor,sentenced at district courts or at summary courts)(1973-2003) Fig. 5-3-1-9Trends in the number of persons sentenced to longer imprisonment in ordinary first instance(imprisonment with or without labor,sentenced at district courts)(1973-2003) (3) Background etc.to lengthening of the term of imprisonment As outlined above,the term of imprisonment has become longer as a whole.However,the trend of sentencing varies depending on the type of offense.Therefore,we analyze the distributions of sentences for several types of offense to seek the background of the trend of longer imprisonment term.
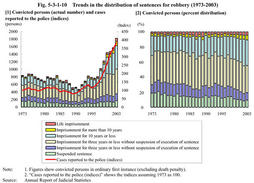
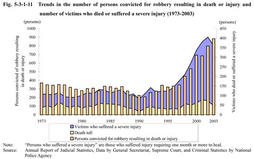
a. Robbery Fig. 5-3-1-10 shows the trend in the distribution of sentences of persons convicted for robbery in the ordinary first instance(excluding death penalty).The number of reported robbery cases has increased significantly in recent years. Fig. 5-3-1-10[1] shows the distribution of the length of sentences in actual figures,as well as the number of cases reported to the police as indices assuming1973as100. Fig. 5-3-1-10[2] shows the distribution of the length of sentenced imprisonment terms by percent distribution.
The number of robbery cases reported to the police and the number of convicted persons for the crime have increased since1996and1997respectively.In addition,as we follow the trend in the length of imprisonment sentenced at courts,the ratio of persons sentenced to imprisonment for more than five years had begun to increase while persons granted suspension of execution of sentence or sentenced to imprisonment for three years or less had begun to decrease since around the same years. Fig. 5-3-1-10Trends in the distribution of sentences for robbery(1973-2003) Since many offenders committing robbery are sentenced to longer imprisonment,including life imprisonment,they have significantly influenced the worsening prison overcrowding,contributing both increase in the number of inmates and in length of the imprisonment term. Fig. 5-3-1-11Trends in the number of persons convicted for robbery resulting in death or injury and number of victims who died or suffered a severe injury(1973-2003) b. Other violent offenses Court sentencing has become harsher recently for violent offenses other than robbery,such as homicide,injury,rape,injury or death caused by professional negligence.This trend is probably due to the deteriorating condition of public safety,in addition to the wide-spread recognition that the criminal justice agency should give more sensitive consideration to victims and to bereaved families and make efforts to protect them.As representative example,we will focus on the trend of court sentencing for traffic accidents.
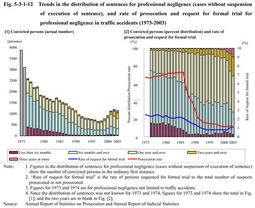
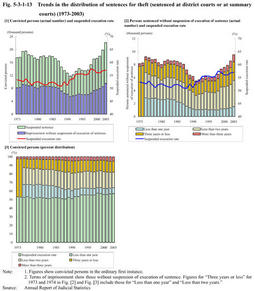
Fig. 5-3-1-12[1] shows the distribution of the number of offenders according to the length of their sentenced imprisonment terms without suspension of execution of sentence in professional negligence cases. Fig. 5-3-1-12[2] shows the percent distribution as well as the rate of prosecution and the rate of request for formal trial for professional negligence in traffic accidents. The prosecution rate for professional negligence in traffic accidents showed a significant decrease since1987.The reason for this is probably the public prosecutors office's consideration to the current highly motorized society such that it would be inappropriate to subject the majority of nationals to criminal punishment for minor negligent cases.Thus,the office seemingly reviewed their policy to handle such traffic cases depending on their gravity so prosecutors may suspend prosecution for relatively minor cases but may respond harshly to heinous crimes. The rate of request for formal trial also started to decrease around1987and had maintained the same level since1993until it started to increase slightly from2001.Sentences of imprisonment for two years or more have increased since around1997and the increase has become significant since2001.This coincided with the new establishment of the offense concerning dangerous driving resulting in death or injury(2001).This offense is established as a response to the public demand for harsher punishment to commensurate with the gravity of dangerous reckless driving.Since the establishment of this new penalty,public prosecutors offices and courts came to respond even more appropriately to heinous offenses(for situations in2002and2003of prosecution and courts with regard to the offense concerning dangerous driving resulting in death or injury,see Part1,Chapter1,Section3-3 ). Fig. 5-3-1-12Trends in the distribution of sentences for professional negligence(cases without suspension of execution of sentence),and rate of prosecution and request for formal trial for professional negligence in traffic accidents(1973-2003) c. Theft Next,we will review the trend of court sentencing for theft,which accounts for the largest number in non-traffic penal code offenses. Fig. 5-3-1-13[1] shows the trends in the number of persons convicted for theft in the ordinary first instance(sentenced at a district court or a summary court)and the suspended execution rate. Fig. 5-3-1-13[2] shows the trends in the distribution of sentences of persons sentenced without suspension of execution of sentence and the suspended execution rate. Fig. 5-3-1-13[3] shows the percent distribution by the length of sentenced imprisonment terms of convicted persons without suspension of execution of sentence.
>From the end of the Showa Era to the beginning of the Heisei Era,sentencing of less than one year imprisonment without suspension of execution of sentence decreased and has remained at relatively low level ever since.Meanwhile the suspended execution rate is increasing(see Fig. 5-3-1-13[2] and [3] ).The distribution of sentences other than suspended sentence and imprisonment for less than one year without suspension of execution of sentence has shown no significant changes in its ratio since the beginning of the Heisei Era(see Fig. 5-3-1-13[3] ).As a whole,the tendency of prolonged term of imprisonment cannot be observed in court sentencing decisions for theft. Nevertheless,since the number of convicted persons and of persons sentenced without suspension of execution of sentence for theft is large,the increase in these numbers has significant influence on the trend of population in penal institutions. Fig. 5-3-1-13Trends in the distribution of sentences for theft(sentenced at district courts or at summary courts)(1973-2003) d. Stimulant Drug Control Law Violations Among special law offenses,the increase compared to the number in1973is particularly significant in Stimulant Drug Control Law violations.Abuse of stimulant drugs has been the main form of drug abuse in Japan and a trend of lengthier term of imprisonment for stimulant drug control law violations is apparent.
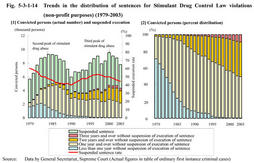
Fig. 5-3-1-14 shows the trends in the distribution of sentences since1979,when statistical data became available for Stimulant Drug Control Law violations for non-profit purposes. Fig. 5-3-1-14[1] shows the distribution of length of sentenced imprisonment in terms of actual figures and of the suspended execution rate. Fig. 5-3-1-14[2] shows the distribution of persons sentenced without suspension of execution of sentence by the percent distribution. From1979to1990,there were decreases in the suspended execution rate and the ratio of imprisonment for less than one year without suspension of execution of sentence.Stimulant drug abuse increased through1965to1984,and in1984it hit a peak in the second wave of stimulant drug abuse.In response,court sentencing without suspension of execution of sentence has increased and the term of imprisonment became longer. The suspended execution rate started to rise,as cases of stimulant drug control law violations decreased after hitting the peak.However,the rate started to decline again in1998.Length of the imprisonment has also become longer,which is especially apparent with the increase of sentences for more than two or three years without suspending the execution.The prolonged term of imprisonment resulted partly from the spread of stimulant drug abuse for the third time and partly from an increasing number of persons with previous stimulant drug control law violation convictions. Compared to1973,the number of persons convicted for violations of the law has increased(see Fig. 1-1-4-14 )and the length of their imprisonment significantly increased as outlined above.These aspects have evidently had a considerable influence on the trend of population in penal institutions. Fig. 5-3-1-14 Trends in the distribution of sentences for Stimulant Drug Control Law violations(non-profit purposes)(1979-2003) (4) Intermediate summary As offenses increase,not only do the numbers of prosecuted or convicted persons increase but for certain offenses,courts may increase sentence imprisonment without suspending the execution thus changing the suspended execution rate or sentencing longer imprisonment terms.
Changes in the suspended execution rate and prolonged imprisonment do not occur equally for all types of offenses.For example,imprisonment length has not become longer for theft.However,the number of offenders committing robbery who were sentenced to imprisonment without suspension of execution of sentence has increased and court sentencing has become harsher,reflecting the increase in number of offenses and their heinousness.In addition,we could detect a trend of longer imprisonment terms for offenses that may endanger victims'lives or physical safety in accordance with the raising in awareness of victims.Furthermore,the imprisonment term has become longer for abuse of stimulant drugs for non-profit purposes because abuse of stimulant drugs shows no signs of decrease. Thus,we could find reasonable reasons and backgrounds for the increase in the number of convicted persons and the prolonged term of imprisonment in recent years.The trend indicates that criminal justice agencies have responded to complaints from victims and to the increase in number of offenses and their heinousness.However,this trend appears as overcrowded prisons at correctional stage.In this context,current situation of penal institutions may be regarded as"overcrowding within the high-crime society." |