Fig. II-10 shows trends in numbers of newly imprisoned offenders and the female inmate ratio (the ratio of women within newly imprisoned offenders) since 1946.
Fig. II-10 Trends in newly imprisoned offenders and the female inmate ratio (1946-1999)
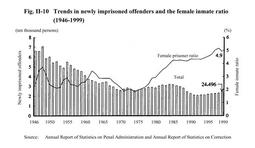
The number of newly imprisoned offenders peaked at 70,727 in 1948, reflecting the social instability following the war. Thereafter, it was in a generally declining trend until reaching 25,728 in 1974. From 1975 it again turned slightly upwards, reaching 32,060 in 1984. But from 1985 it returned to a gradually decreasing trend, falling to a record postwar low of 20,864 in 1992. Since 1993, however, it has again turned upwards, increasing by 1,395 (6.0%) to reach 24,496 in 1999 (see
Appendix II-6 ). The number of newly imprisoned female offenders has been increasing gradually since 1993, rising to 1,207 in 1999 (source:Annual Report of Statistics on Correction).