Chapter 2 Trends in Offenses Committed by Females
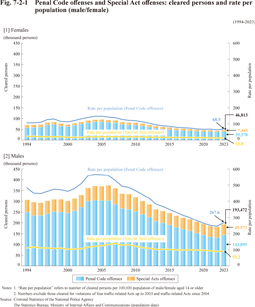
Fig. 7-2-1 shows the trend in the number and rate per population of cleared persons for Penal Code offenses and Special Act offenses over the last 30 years, by male/female.
Fig. 7-2-1 Penal Code offenses and Special Act offenses: cleared persons and rate per population (male/female)
Click here for the Excel file (Japanese)
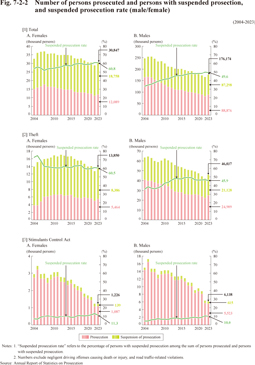
Fig. 7-2-2 shows the trend in the number of persons prosecuted and persons with suspended prosecution as well as the suspended prosecution rate over the last 20 years, by male/female, in cases disposed by public prosecutors (excluding negligent driving offenses causing death or injury and road traffic-related violations).
Fig. 7-2-2 Number of persons prosecuted and persons with suspended prosection, and suspended prosecution rate (male/female)
Click here for the Excel file (Japanese)
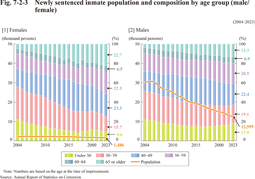
Fig. 7-2-3 shows the trend in the number and composition by age group and by male/female of newly sentenced inmates over the last 20 years.
Fig. 7-2-3 Newly sentenced inmate population and composition by age group (male/female)
Click here for the Excel file (Japanese)
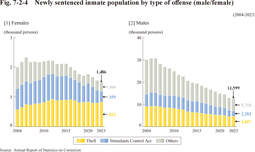
Fig. 7-2-4 shows the trend in the number by type of offense and by male/female of newly sentenced inmates over the last 20 years.
Fig. 7-2-4 Newly sentenced inmate population by type of offense (male/female)


