Chapter 2 Crime Trends during the COVID-19 Pandemic
Section 1 Trends in Major Crimes
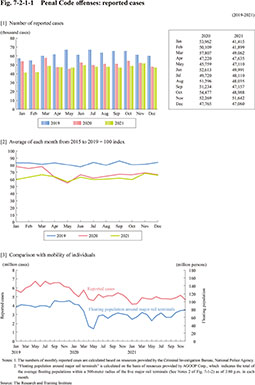
Fig. 7-2-1-1 [1] shows the monthly trend in the number of reported cases for Penal Code offenses from 2019 to 2021.
Fig. 7-2-1-1 [2] shows a comparison between reported cases for Penal Code offenses in the same month of 2019-2021, and the monthly averages of 2015-2019. The monthly averages of 2015-2019 are converted to 100.
Fig. 7-2-1-1 [3] shows a comparison between reported cases for Penal Code offenses in the same month of 2019-2021, and the floating populations (mobility of individuals) around the five major rail terminals.
Fig. 7-2-1-1 Penal Code offenses: reported cases
