1 Juveniles newly committed to juvenile training schools
(1) Number of juveniles newly committed to juvenile training schools
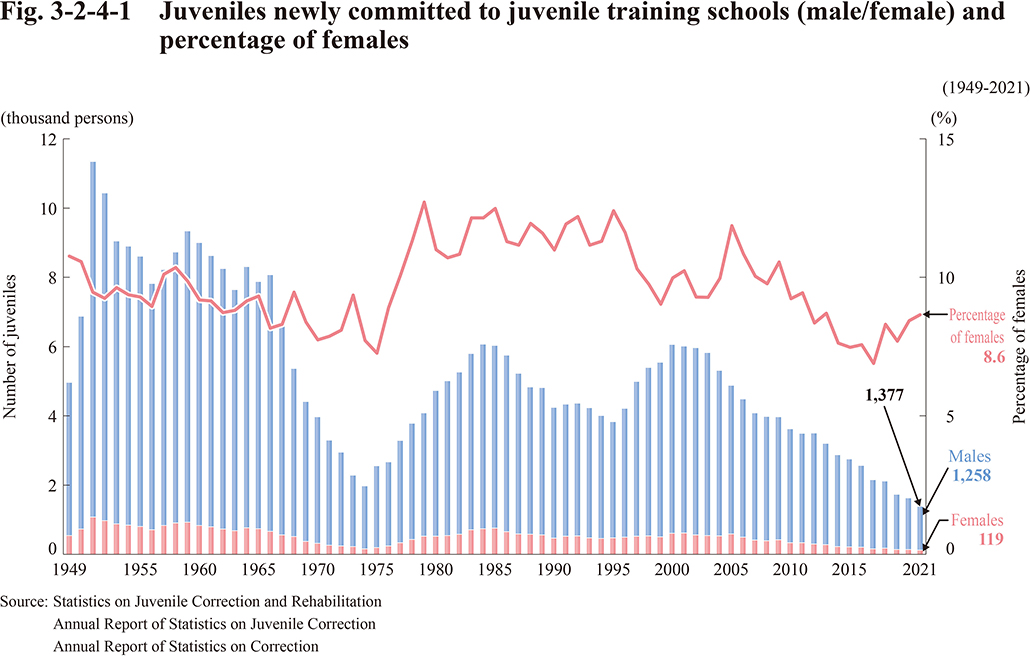
Fig. 3-2-4-1 shows the trend in the number of juveniles newly committed to juvenile training schools by male/female and the percentage of females since 1949.
Fig. 3-2-4-1 Juveniles newly committed to juvenile training schools (male/female) and percentage of females
Click here for the Excel file (Japanese)
(2) Characteristics of juveniles newly committed to juvenile training schools
A. Age
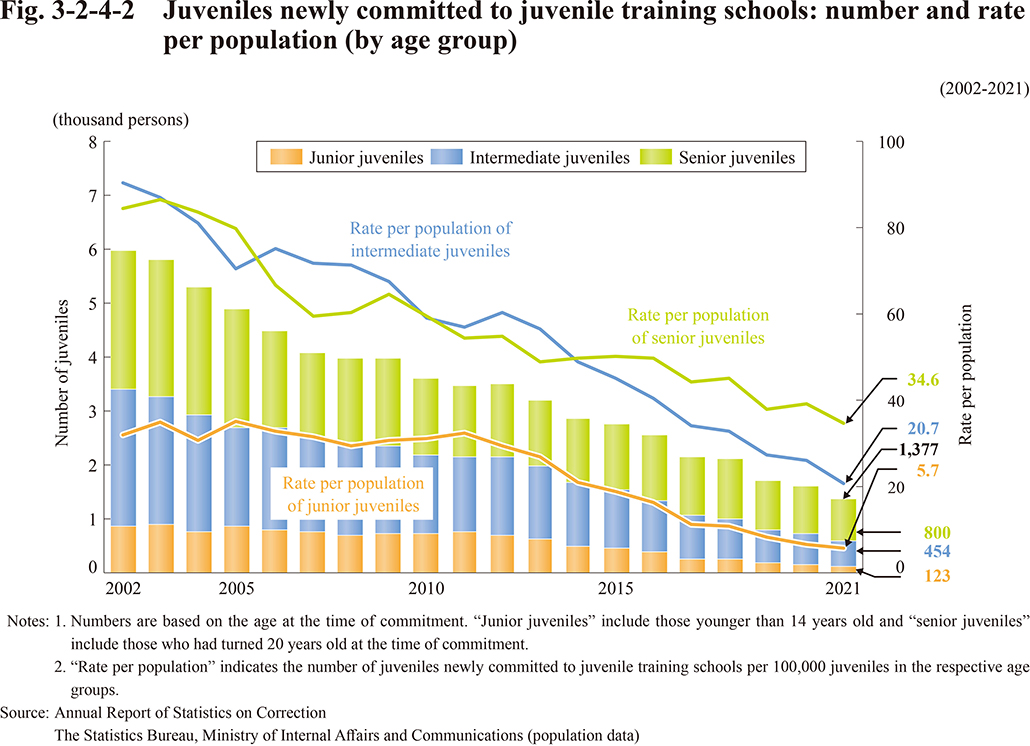
Fig. 3-2-4-2 shows the number and rate per population of juveniles newly committed to juvenile training schools by age group.
Fig. 3-2-4-2 Juveniles newly committed to juvenile training schools: number and rate per population (by age group)
Click here for the Excel file (Japanese)
B. Types of delinquency
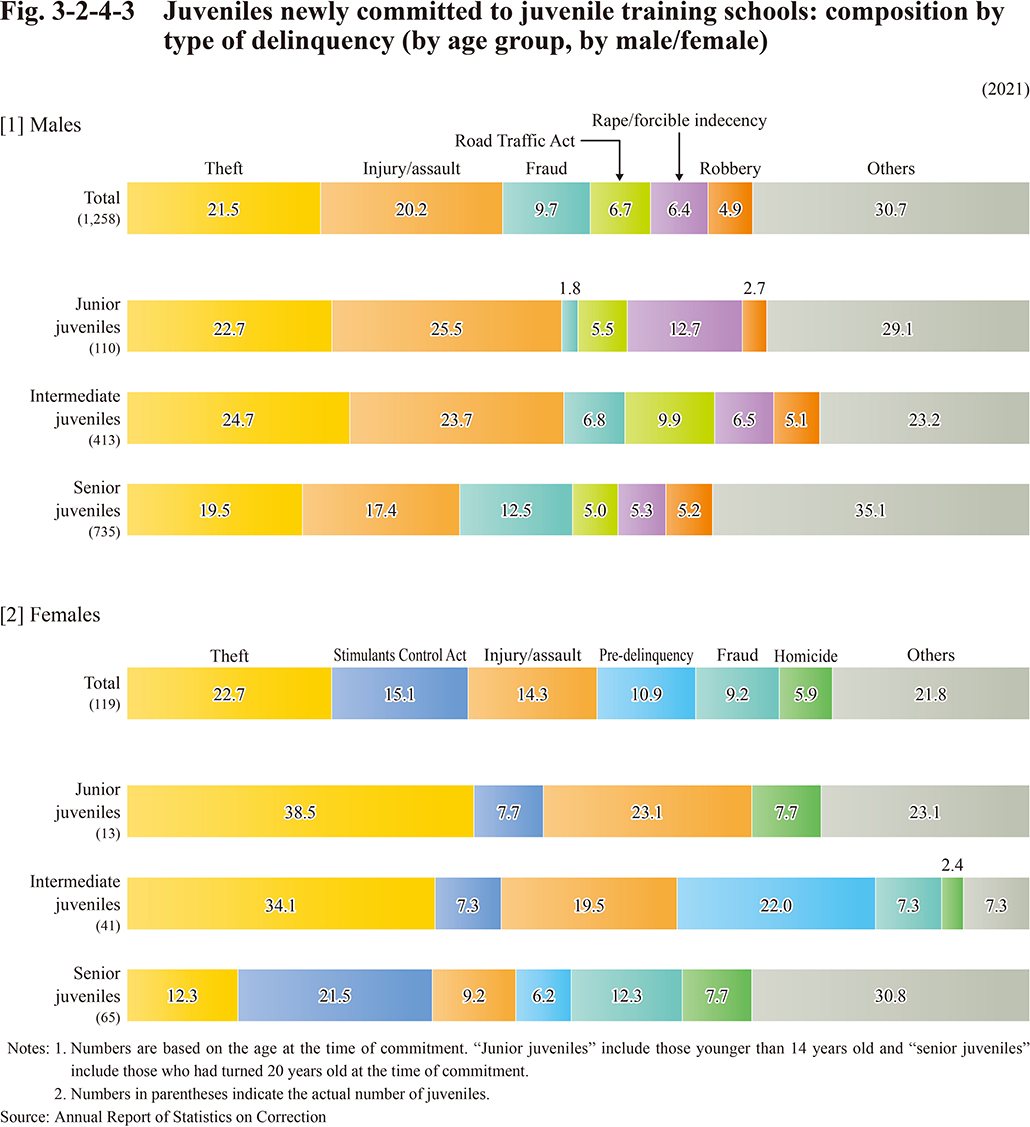
Fig. 3-2-4-3 shows the composition by type of delinquency committed by juveniles newly committed to juvenile training schools in 2021, by male/female and age group.
Fig. 3-2-4-3 Juveniles newly committed to juvenile training schools: composition by type of delinquency (by age group, by male/female)