Chapter 1 Trends in Juvenile Delinquency
Section 1 Penal Code Offenses Committed by Juveniles
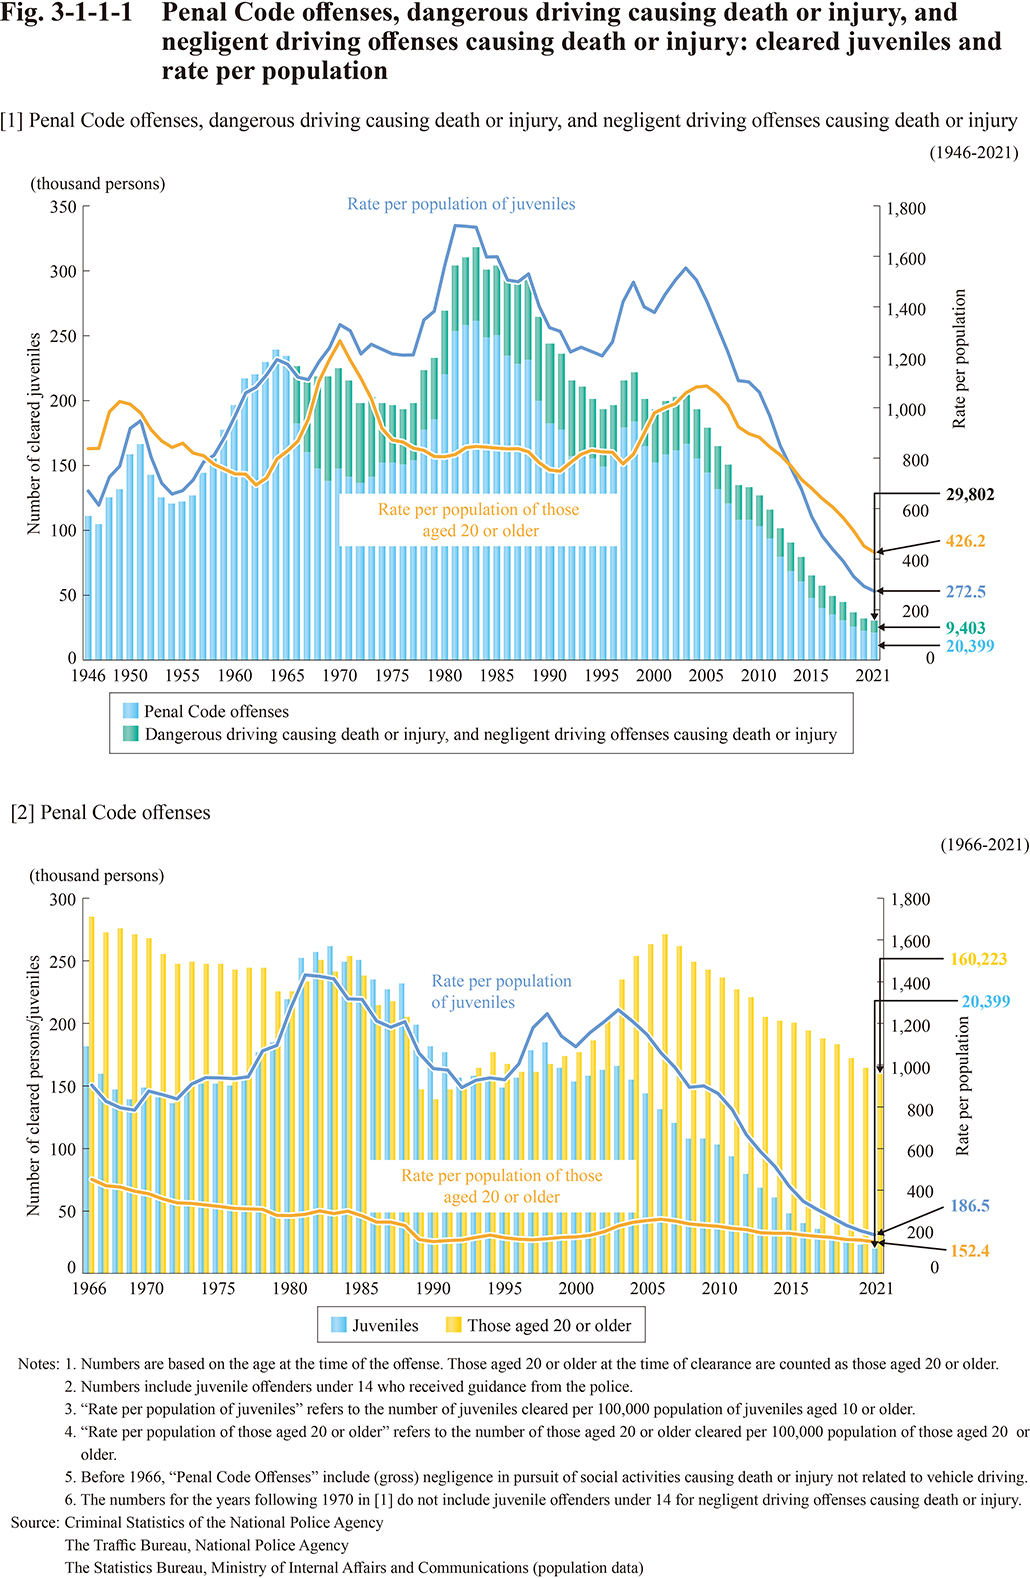
Fig. 3-1-1-1 [1] shows the trend in the number and rate per population of juveniles cleared (including juvenile offenders under 14 who received guidance from the police; hereinafter the same applies in this Section) for Penal Code offenses, dangerous driving causing death or injury, or negligent driving offenses causing death or injury since 1946. Fig. 3-1-1-1 [2] shows a comparison between the trend in the number and rate per population of juveniles cleared for Penal Code offenses and those aged 20 or older cleared for Penal Code offenses since 1966.
Fig. 3-1-1-1 Penal Code offenses, dangerous driving causing death or injury, and negligent driving offenses causing death or injury: cleared juveniles and rate per population
Click here for the Excel file (Japanese)
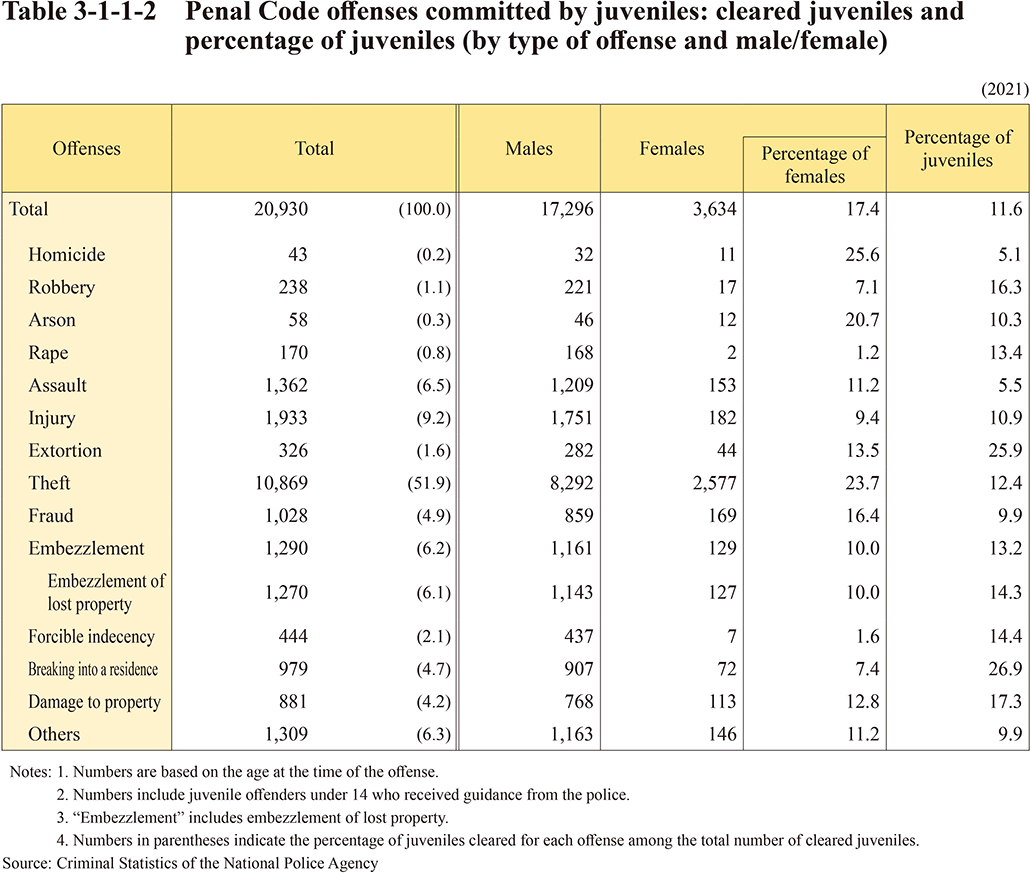
Table 3-1-1-2 shows the composition by type of offense committed by juveniles cleared for Penal Code offenses in 2021.
Table 3-1-1-2 Penal Code offenses committed by juveniles: cleared juveniles and percentage of juveniles (by type of offense and male/female)