1 Probationers/parolees
(1) Number of persons newly placed under probation/parole supervision
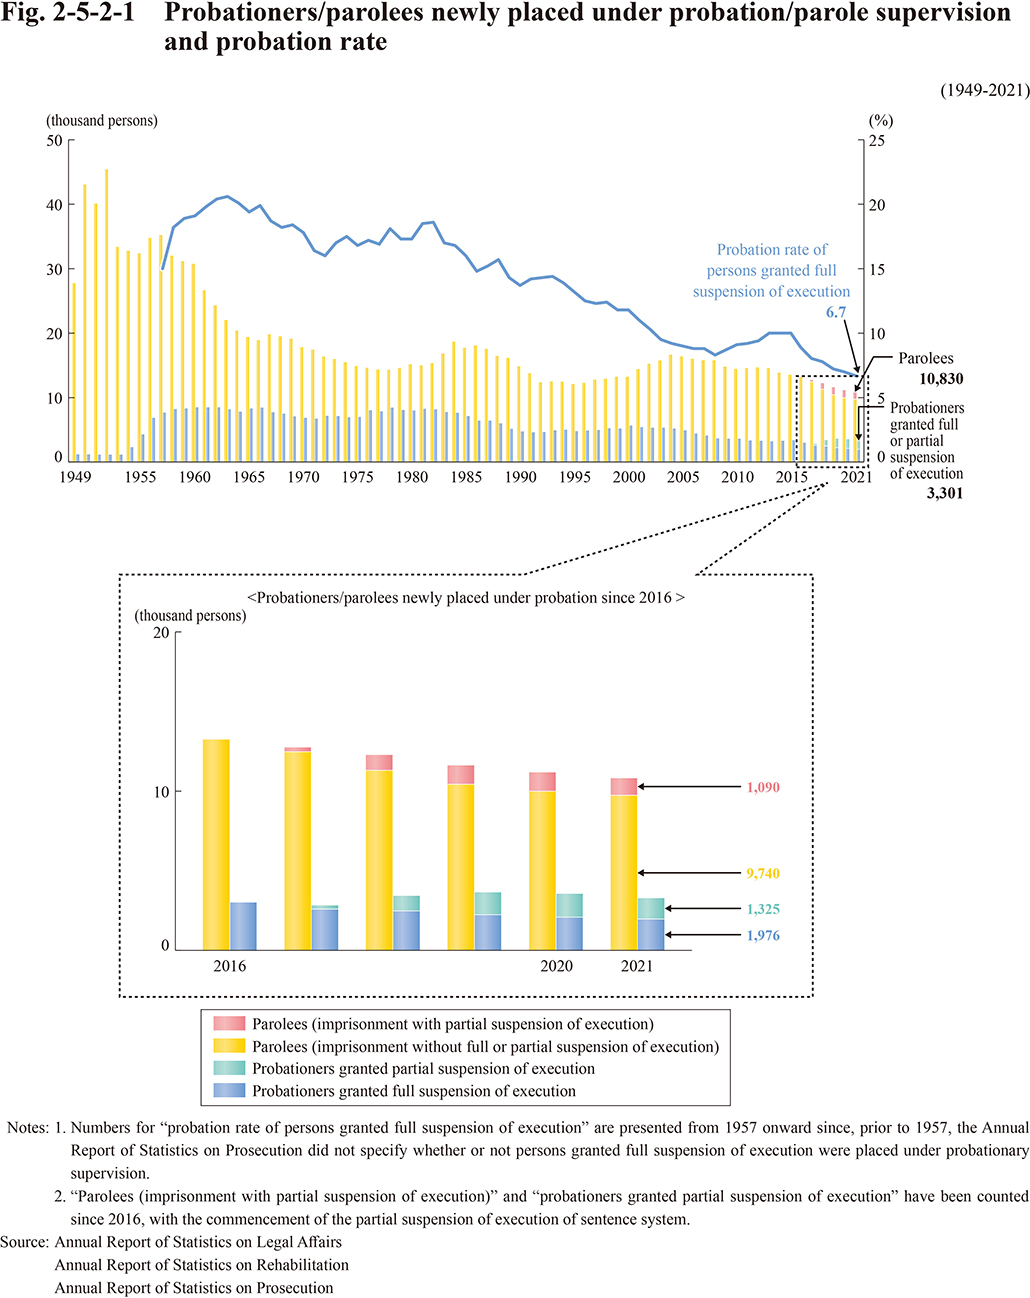
Fig. 2-5-2-1 shows the trend in the number of probationers/parolees newly placed under probation/parole supervision since 1949 and the trend in the probation rate among those granted full suspension of the execution of their sentence since 1957.
Fig. 2-5-2-1 Probationers/parolees newly placed under probation/parole supervision and probation rate
Click here for the Excel file (Japanese)
(2) Age of probationers/parolees
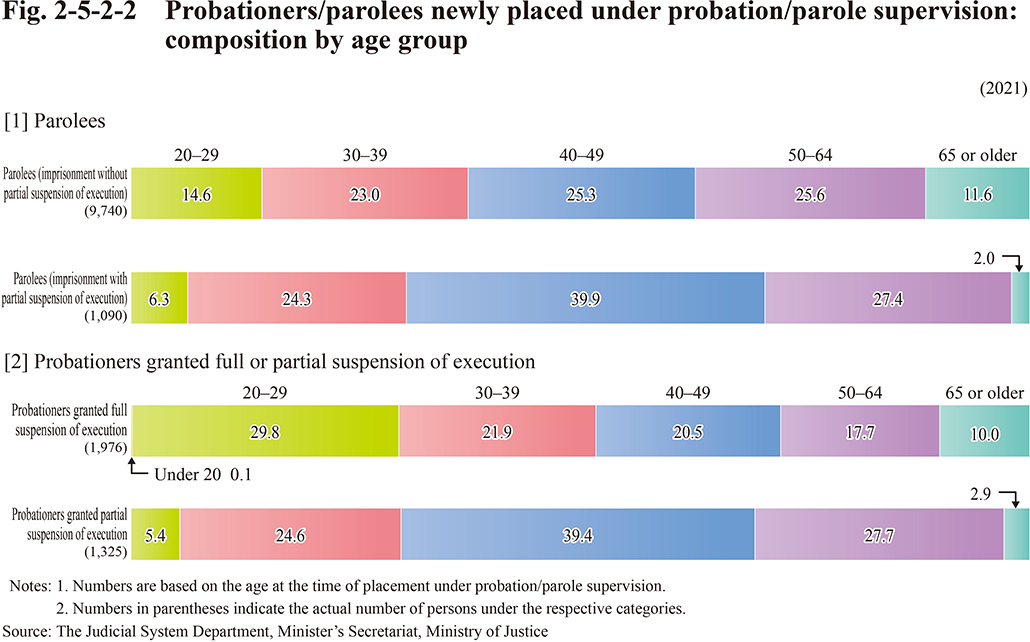
Fig. 2-5-2-2 shows the composition by age group of probationers/parolees newly placed under probation/parole supervision in 2021.
Fig. 2-5-2-2 Probationers/parolees newly placed under probation/parole supervision: composition by age group
Click here for the Excel file (Japanese)
(3) Offenses of probationers/parolees
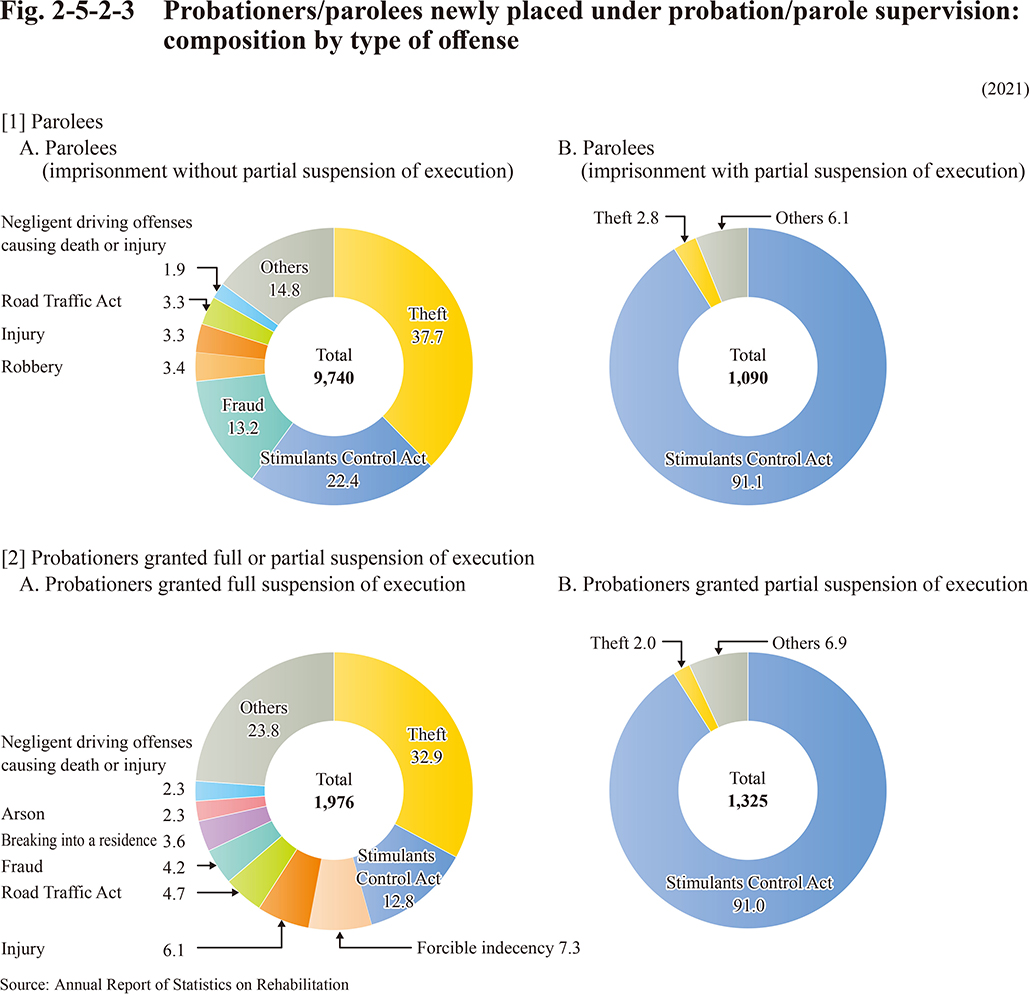
Fig. 2-5-2-3 shows the composition by offense of probationers/parolees newly placed under probation/parole supervision in 2021.
Fig. 2-5-2-3 Probationers/parolees newly placed under probation/parole supervision: composition by type of offense