Chapter 1 Trends in Juvenile Delinquency
Section 1 Penal Code Offenses Committed by Juveniles
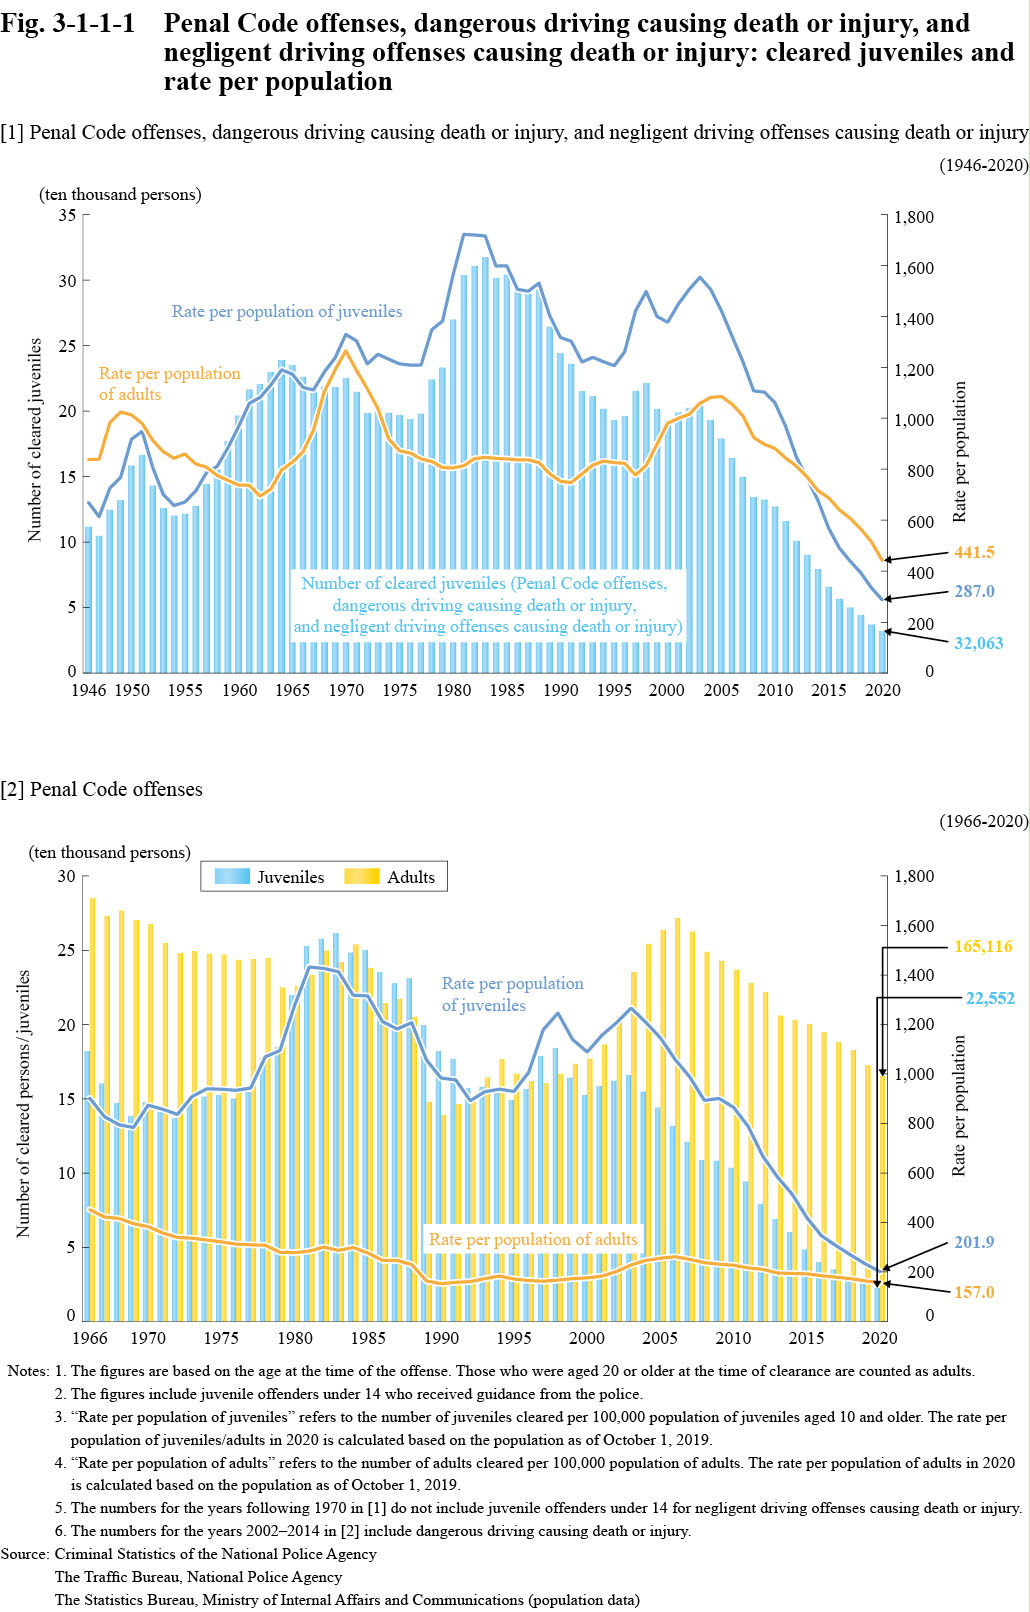
Fig. 3-1-1-1 [1] shows the trend in the number and rate per population of juveniles cleared (including juvenile offenders under 14 who received guidance from the police; hereinafter the same applies in this Section) for Penal Code offenses, dangerous driving causing death or injury, or negligent driving offenses causing death or injury since 1946. Fig. 3-1-1-1 [2] shows a comparison between the trend in the number and rate per population of juveniles cleared for Penal Code offenses and adults cleared for Penal Code offenses since 1966.
Fig. 3-1-1-1 Penal Code offenses, dangerous driving causing death or injury, and negligent driving offenses causing death or injury: cleared juveniles and rate per population
Click here for the Excel file (Japanese)
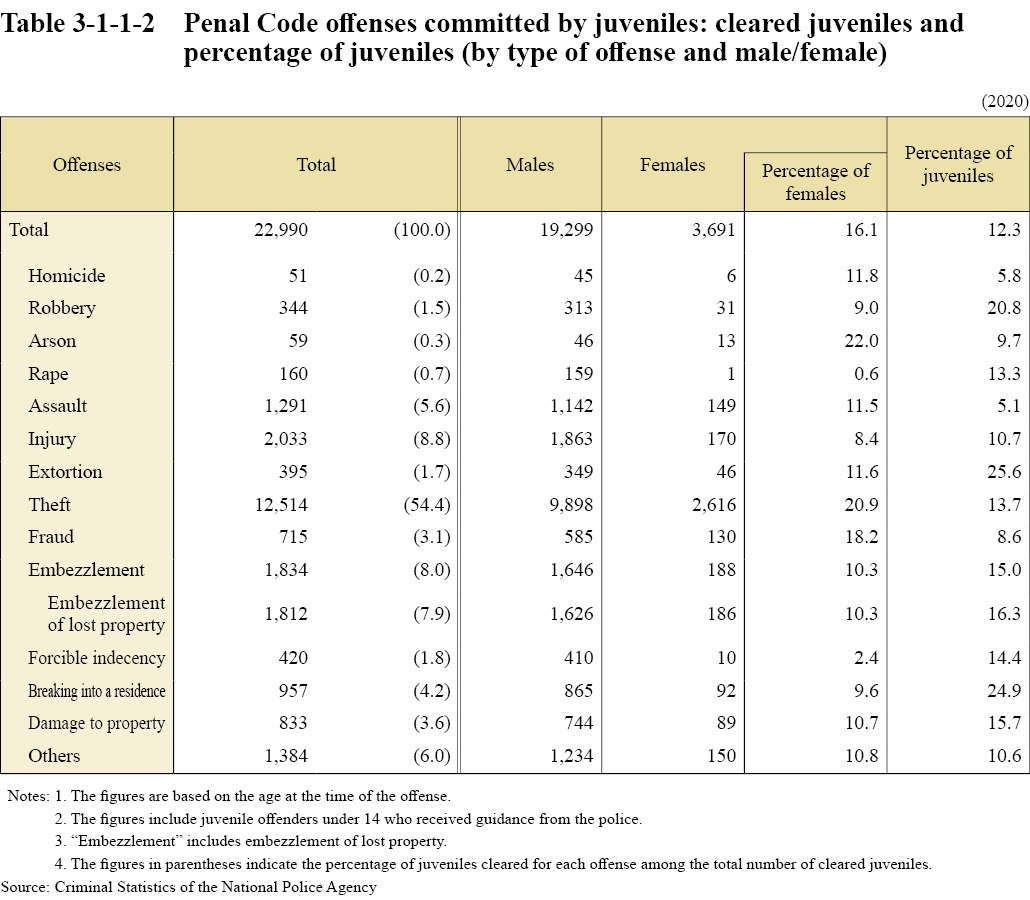
Table 3-1-1-2 shows the composition by type of offense committed by juveniles cleared for Penal Code offenses in 2020.
Table 3-1-1-2 Penal Code offenses committed by juveniles: cleared juveniles and percentage of juveniles (by type of offense and male/female)