Chapter 2 Prosecution
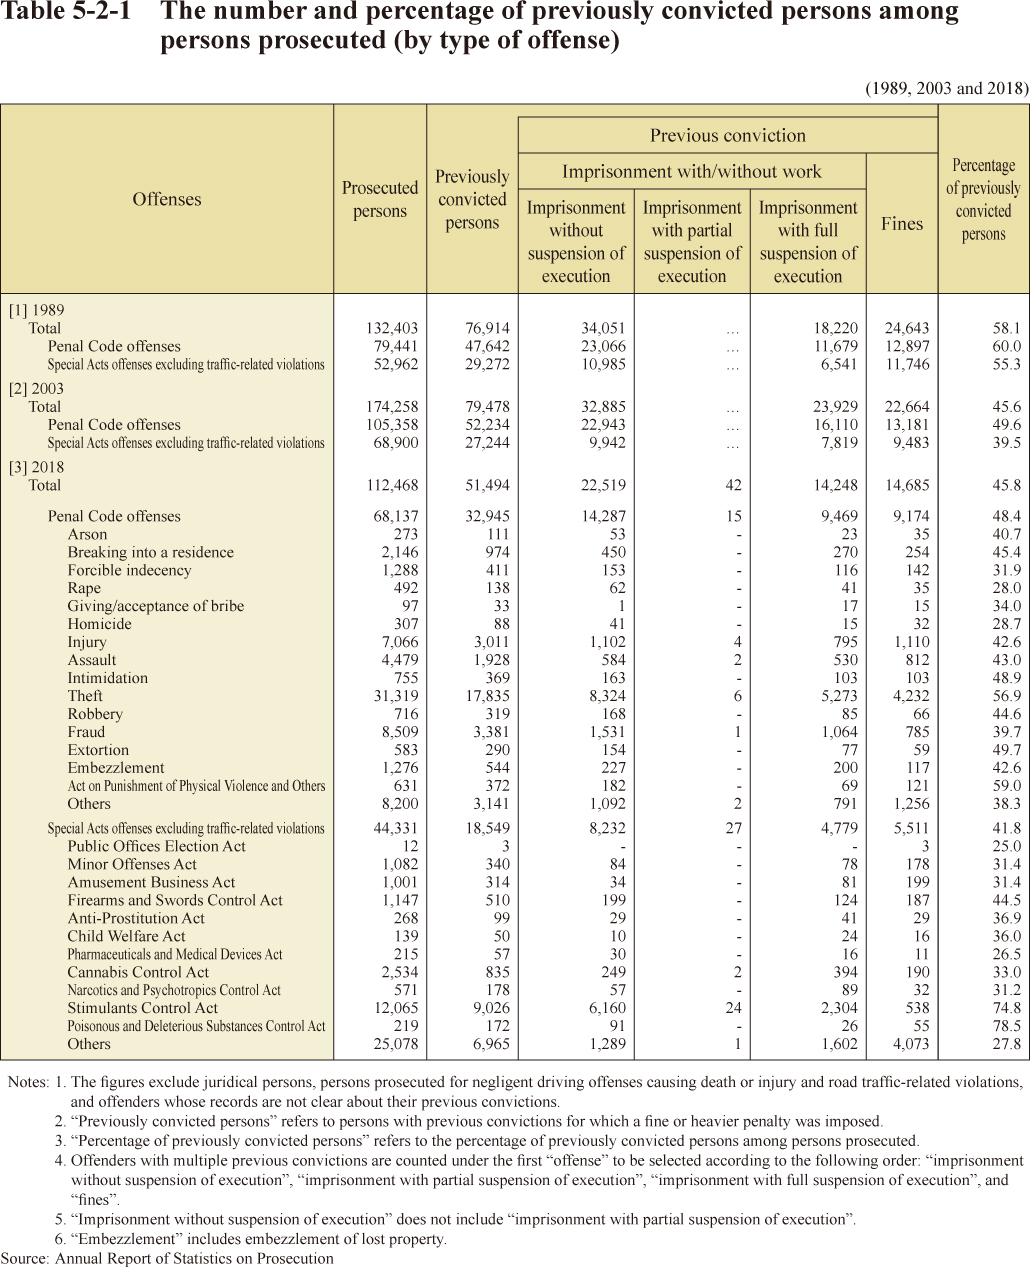
Table 5-2-1 shows the number of persons prosecuted in 1989, 2003 and 2018 (excluding those prosecuted for negligent driving causing death or injury or road traffic-related violations; hereinafter the same applies in this Chapter) who had a previous conviction (the penalty for the previous conviction was a fine or heavier) and the percentage thereof among the total number of prosecuted persons. In 2018, the data is further broken down into the number and percentage by type of offense for which they were prosecuted.
Table 5-2-1 The number and percentage of previously convicted persons among persons prosecuted (by type of offense)