Chapter 8 Offenses by the Elderly
Section 1 Trends in Offenses
Fig. 4-8-1-1 shows the trend in the number of persons cleared for Penal Code offenses by age group and the percentage of elderly persons among the total number of persons cleared for Penal Code offenses, by total/female population.
Fig. 4-8-1-1 Penal Code offenses: persons cleared by age group and percentage of elderly (total/female)
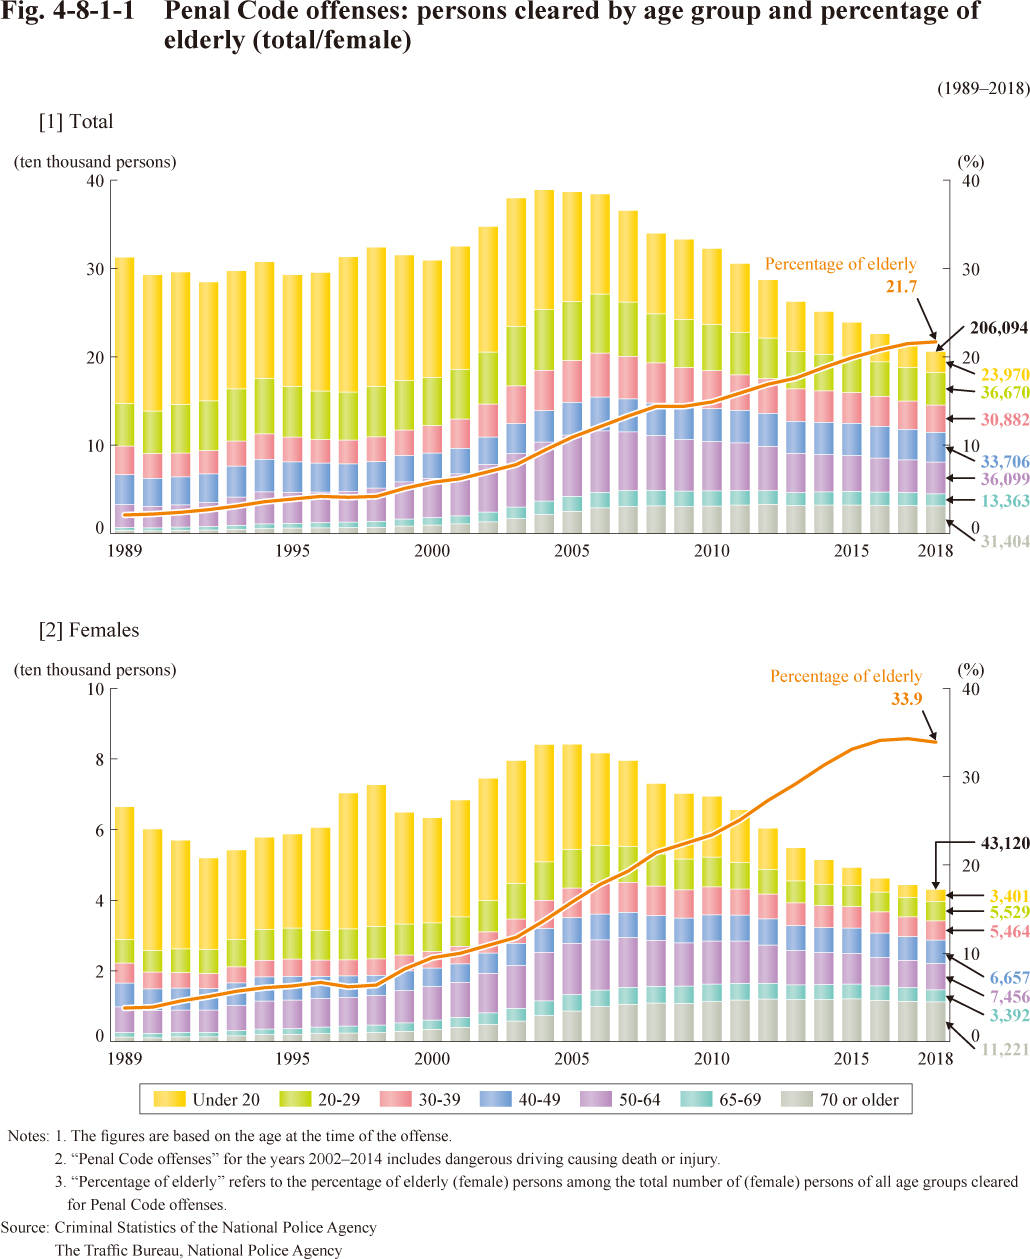
Fig. 4-8-1-2 shows the trend in the rate per population of persons cleared for Penal Code offenses by age group and by total/female population.
Fig. 4-8-1-2 Penal Code offenses: rate per population of persons cleared, by age group (total/female)
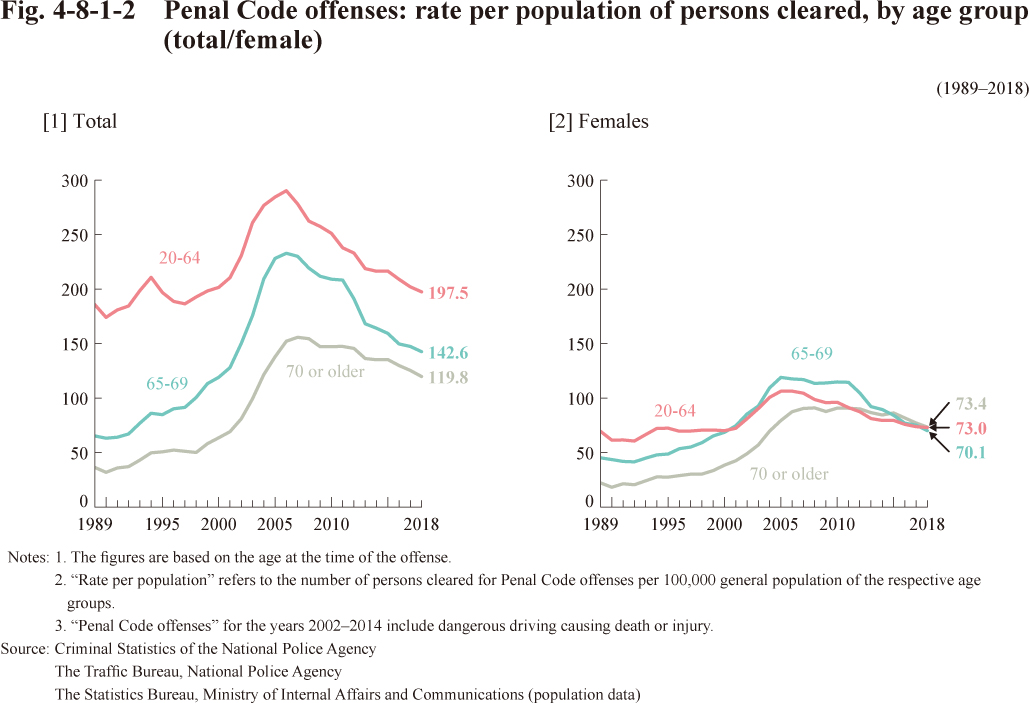
Fig. 4-8-1-3 shows the composition by type of offense committed by elderly persons cleared for Penal Code offenses by gender in 1989, 2003 and 2018.
Fig. 4-8-1-3 Penal Code offenses: composition by type of offense committed by elderly persons cleared (male/female)
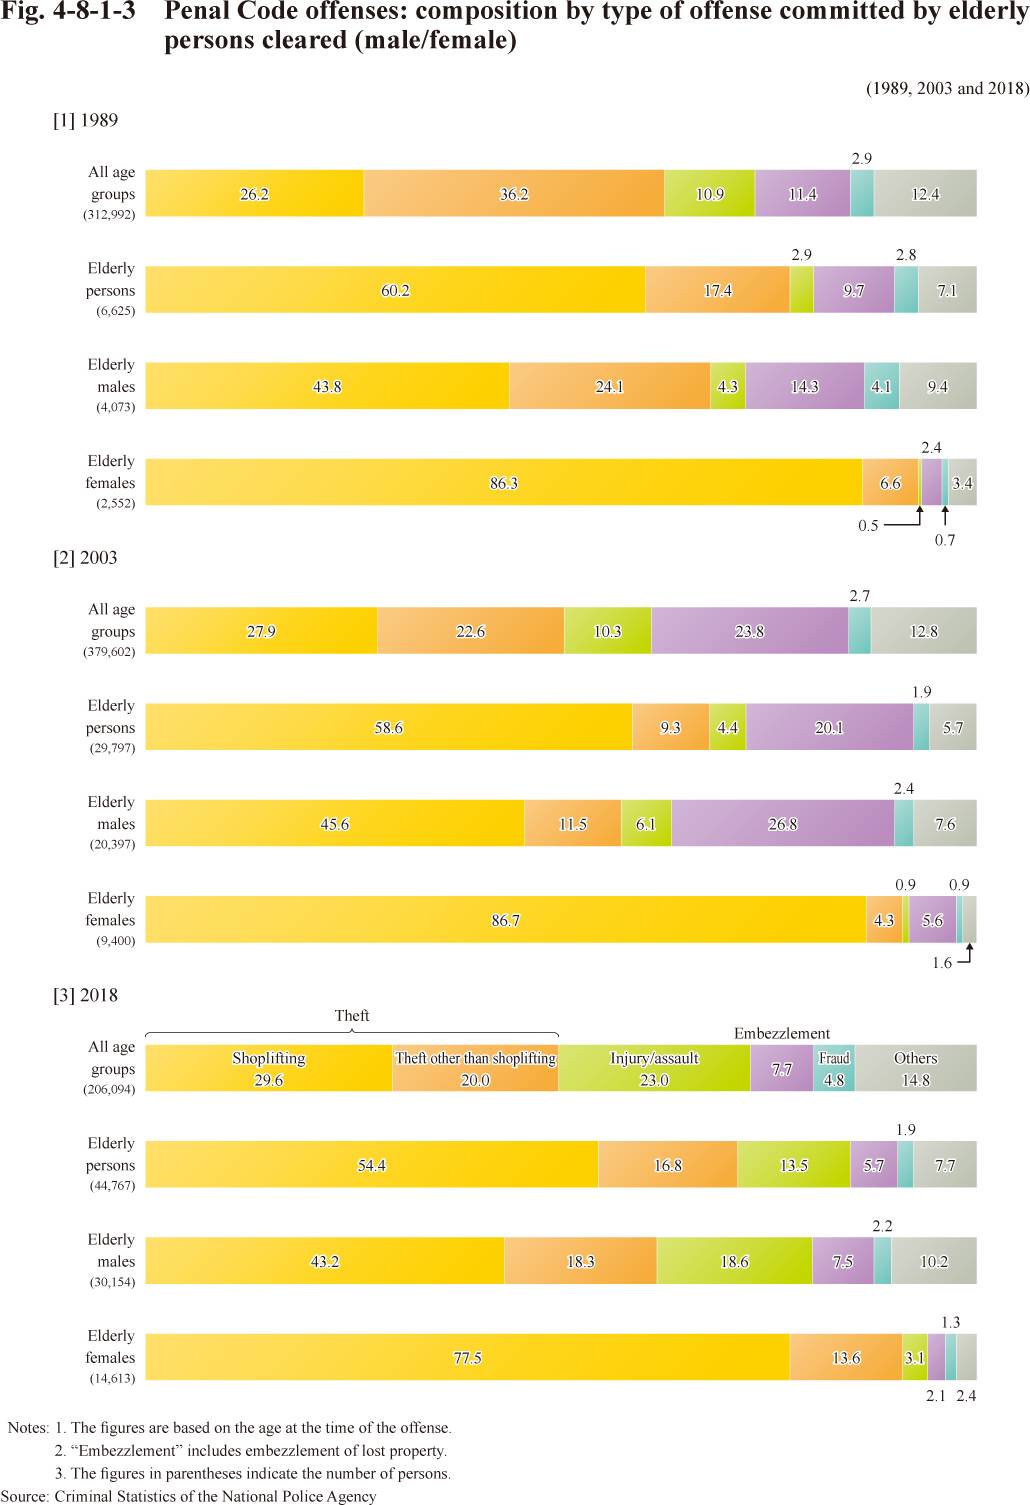
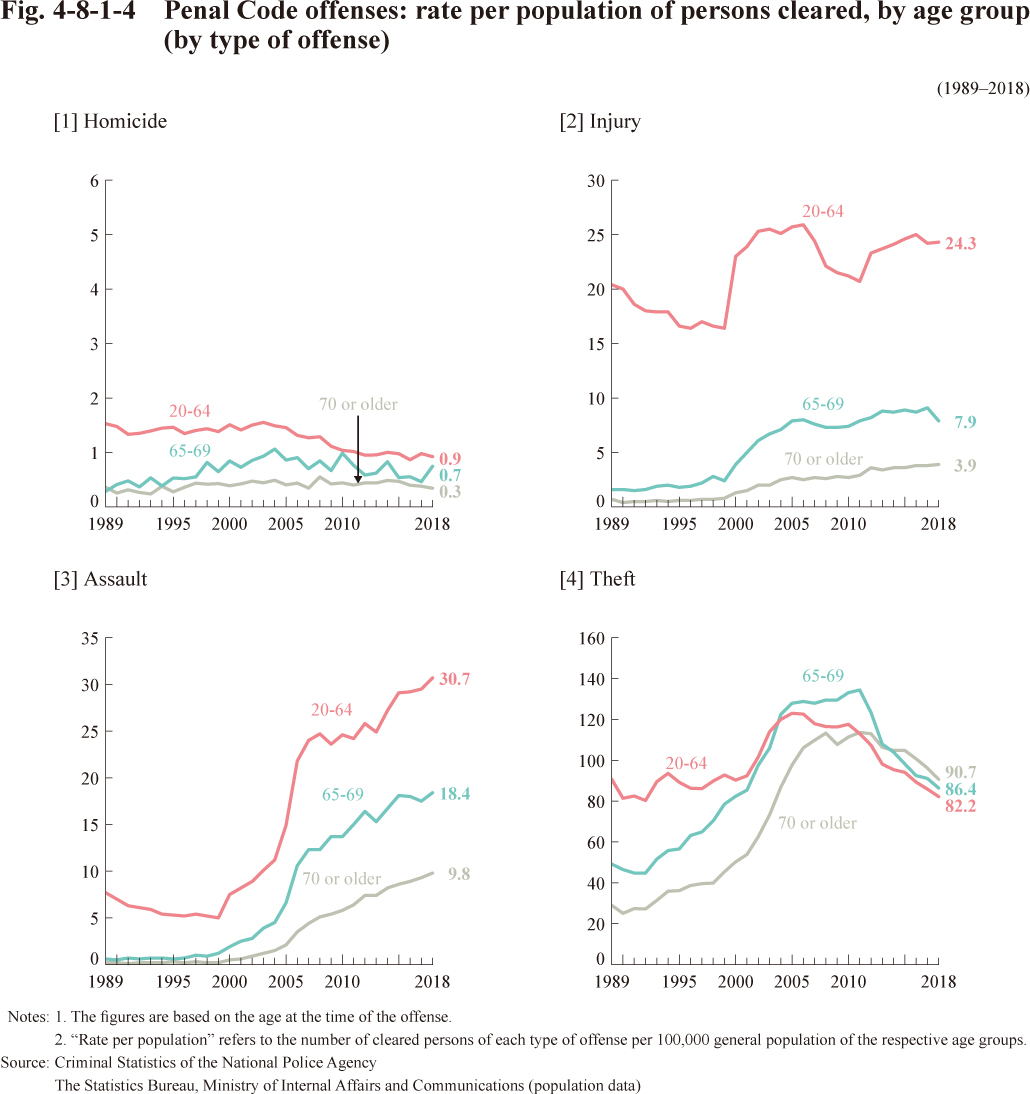
Fig. 4-8-1-4 shows the trend in the rate per population of persons cleared for Penal Code offenses by type of offense and by age group.
Fig. 4-8-1-4 Penal Code offenses: rate per population of persons cleared, by age group (by type of offense)