Section 4 Juvenile Training Schools
1 Juveniles newly committed to juvenile training schools
(1) Number of juveniles newly committed to juvenile training schools
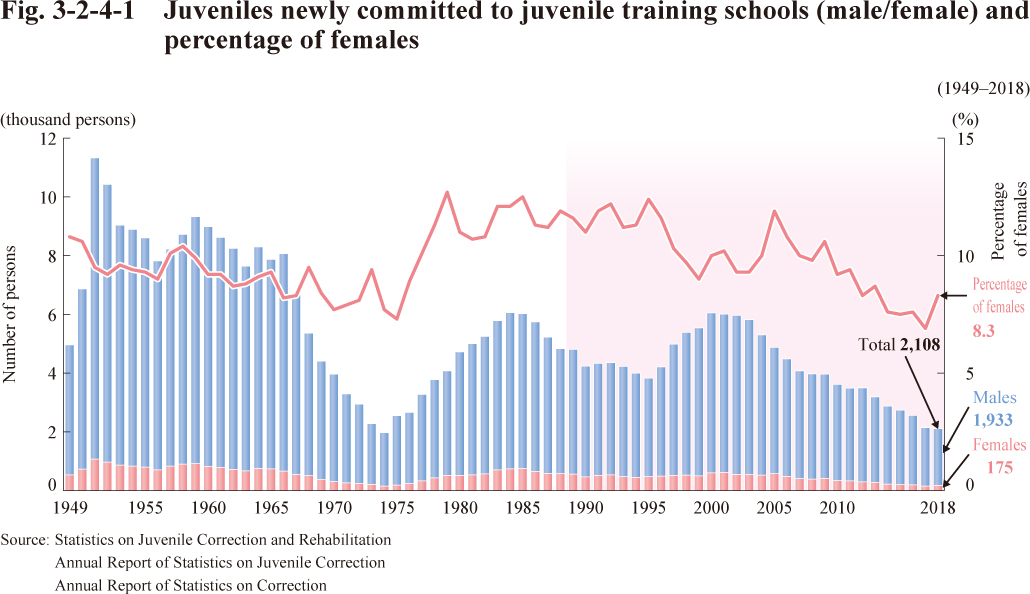
Fig. 3-2-4-1 shows the trend in the number of juveniles newly committed to juvenile training schools by gender and the percentage of females since 1949.
Fig. 3-2-4-1 Juveniles newly committed to juvenile training schools (male/female) and percentage of females
(2) Characteristics of juveniles newly committed to juvenile training schools
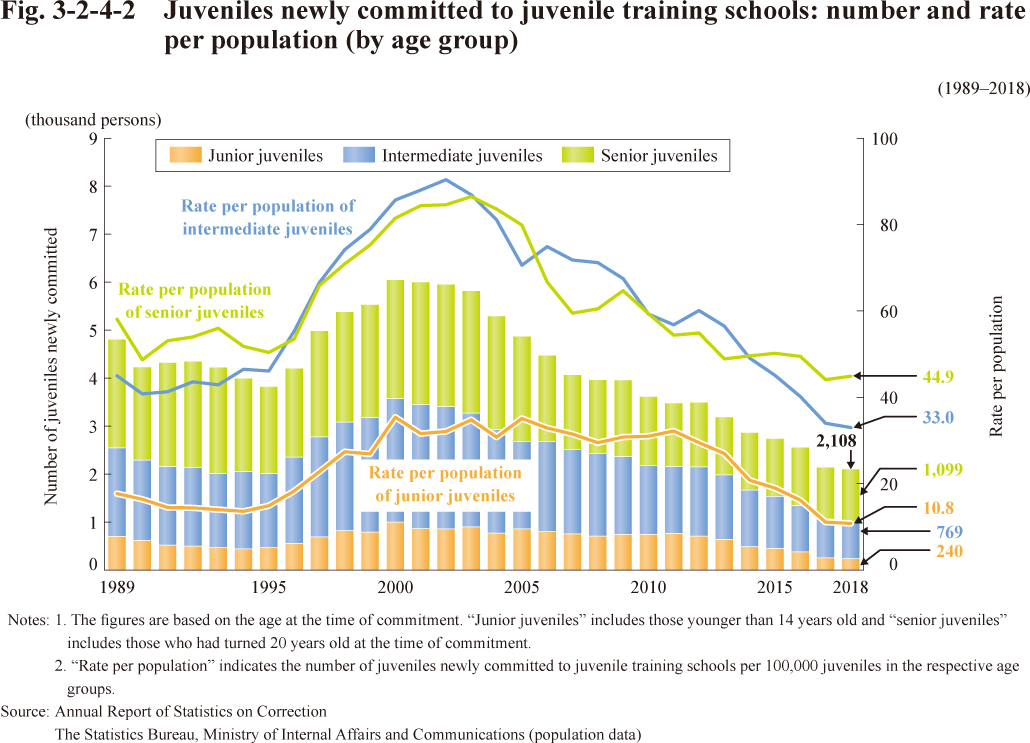
A. Age
Fig. 3-2-4-2 shows the number and rate per population of juveniles newly committed to juvenile training schools by age group.
Fig. 3-2-4-2 Juveniles newly committed to juvenile training schools: number and rate per population (by age group)
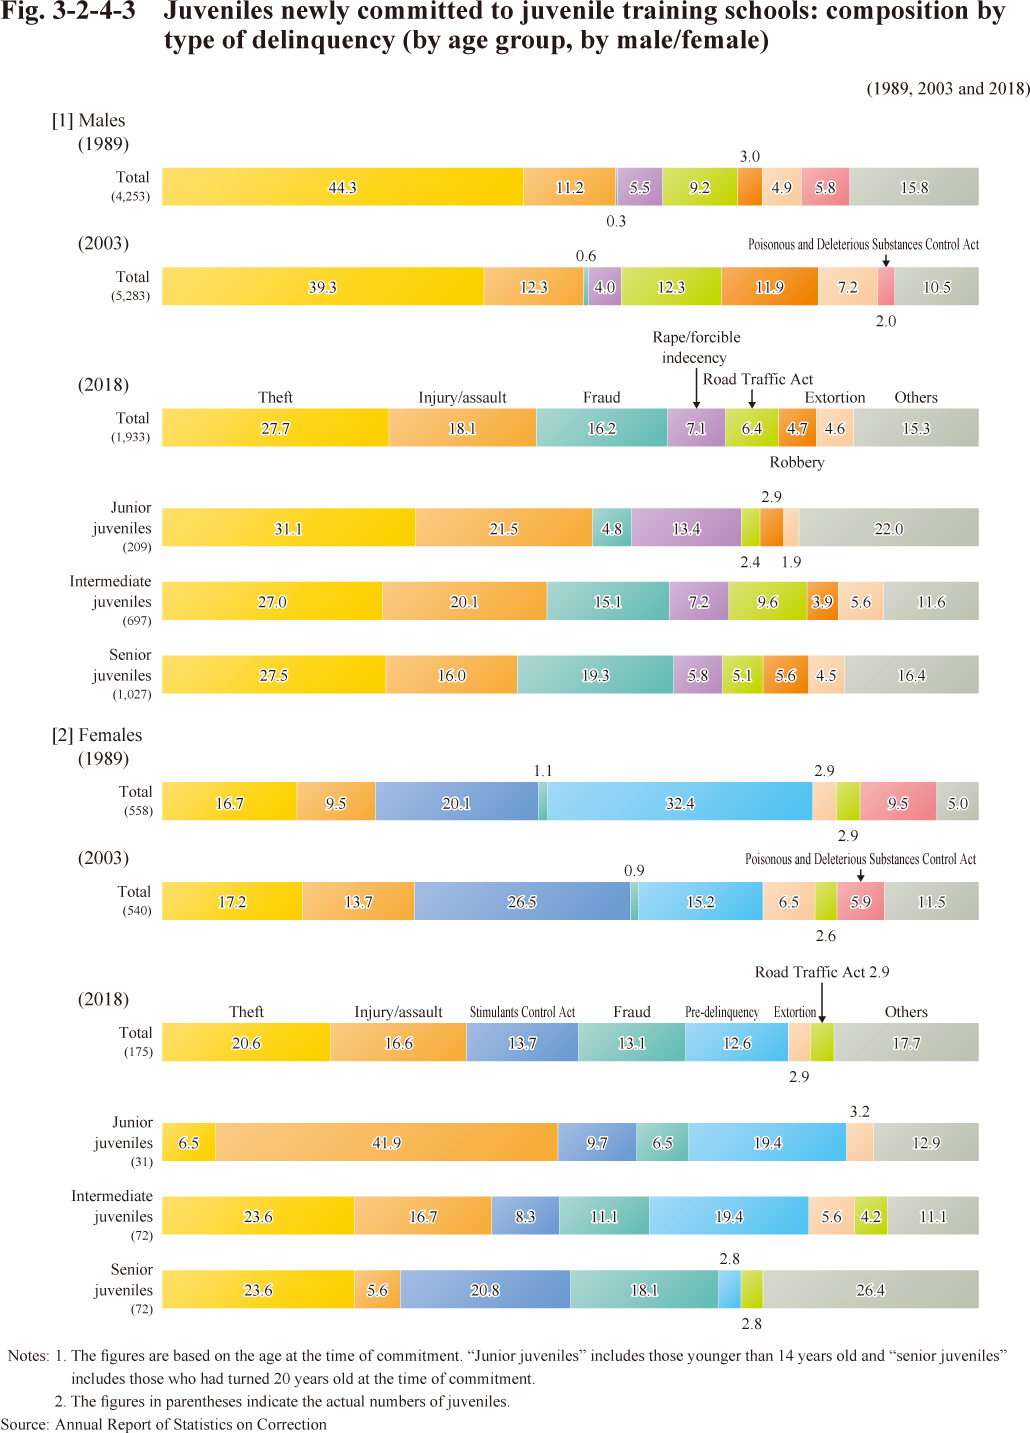
B. Types of delinquency
Fig. 3-2-4-3 shows the composition by type of delinquency committed by juveniles newly committed to juvenile training schools, by gender in 1989, 2003 and 2018, and also by age group in 2018.
Fig. 3-2-4-3 Juveniles newly committed to juvenile training schools: composition by type of delinquency (by age group, by male/female)