3 Characteristics of new inmates
(1) Age
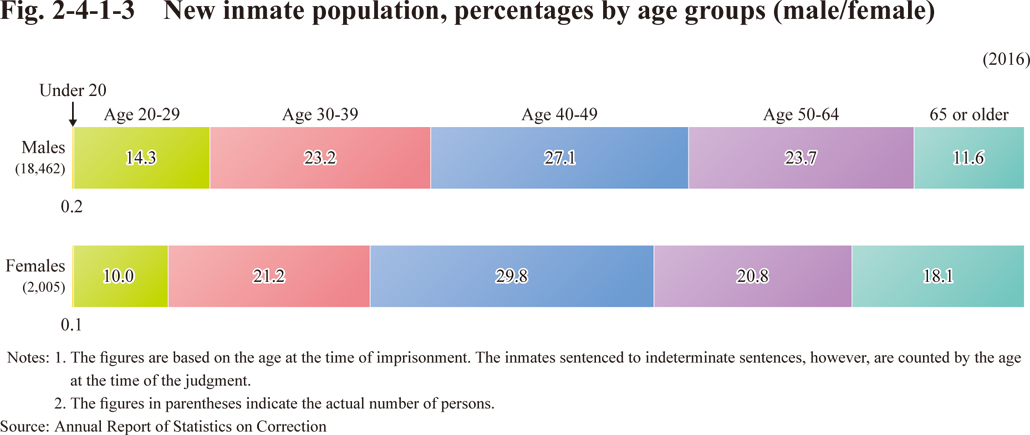
Fig. 2-4-1-3 shows the percentages of new inmates in 2016 by sex and age groups.
Fig. 2-4-1-3 New inmate population, percentages by age groups (male/female)
(2) Types of offense
Fig. 2-4-1-4 shows the percentages of new inmates in 2016 by types of offense and sex (See Table 2-4-1-6).
Fig. 2-4-1-4 New inmate population, percentages by types of offense (male/female)
