Section 2 Disposition
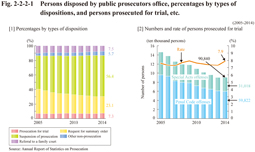
Fig. 2-2-2-1 [1] shows the percentage of dispositions by public prosecutors (including juvenile cases) by types of disposition, and [2] shows the number and the rate of persons prosecuted for trial.
Fig. 2-2-2-1 Persons disposed by public prosecutors office, percentages by types of dispositions, and persons prosecuted for trial, etc
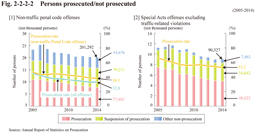
Fig. 2-2-2-2 shows the trends of persons prosecuted or not prosecuted. The prosecution rate for all offenses (including negligentdriving offenses causing death or injury,and traffic-related violations) is shown in the Figure [1].
Fig. 2-2-2-2 Persons prosecuted/not prosecuted
Table 2-2-2-3 shows persons not prosecuted, by the reason of non-prosecution for the alleged non-traffic Penal Code or special Act offense(s) (excluding traffic-relatedviolations).
Table 2-2-2-3 Persons not prosecuted, by the reason


