| Previous Next Index Image Index Year Selection | |
|
|
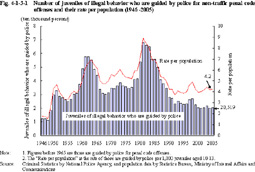
Fig. 4-1-3-1 shows the number of juveniles of illegal behavior who are guided by police for non-traffic penal code offenses and their rate per population since 1946.
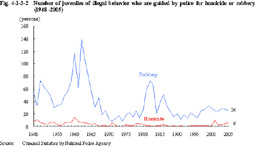
Fig. 4-1-3-1 Number of juveniles of illegal behavior who are guided by police for non-traffic penal code offenses and their rate per population (1946 -2005) Fig. 4-1-3-2 shows the number of juveniles of illegal behavior who are guided by police for homicide or robbery since 1948 (See Appendix 4-6 for the number of juveniles of illegal behavior who are guided by police by major type of delinquency).Fig. 4-1-3-2 Number of juveniles of illegal behavior who are guided by police for homicide or robbery (1948 -2005) The number of juveniles of illegal behavior finally disposed by family courts (excluding those who were referred to family courts by summary procedure) in general juvenile cases (excluding negligence in the pursuit of social activities and dangerous driving causing death or injury) has been on a rise since 1997, but in 2005, it decreased by 9.8% from the previous year to 120 juveniles. By type of delinquency, theft accounted for the largest share each year, and was 49.2% in 2005, followed by injury at 19.2% (Source: Annual Report of Judicial Statistics). |

