| Previous Next Index Image Index Year Selection | |
|
|
1 Disposition by public prosecutors offices
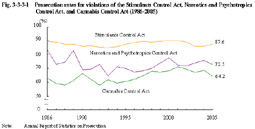
Fig. 3-3-3-1 shows prosecution rates for violations of the Stimulants Control Act, Narcotics and Psychotropics Control Act, and Cannabis Control Act over the last 20 years.
Fig. 3-3-3-1 Prosecution rates for violations of the Stimulants Control Act, Narcotics and Psychotropics Control Act, and Cannabis Control Act (1986-2005) |
