| Previous Next Index Image Index Year Selection | |
|
|
2 Firearm offenses (1) Antagonistic fights and firing incidents
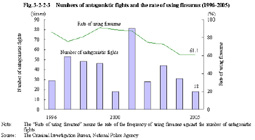
Fig. 3-2-2-3 shows the number of antagonistic fights among Boryokudan groups and the rate of using firearms (firearms mean handguns, rifles, machine guns, cannons, hunting rifles and other guns which have the function of firing metal bullets, and air guns) (the rate of the frequency of using firearms against the number of antagonistic fights) over the last 10 years.
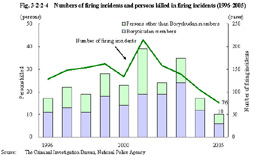
Fig. 3-2-2-3 Numbers of antagonistic fights and the rate of using firearms (1996-2005) Fig. 3-2-2-4 shows the number of firing incidents and persons killed in firing incidents over the last 10 years.Fig. 3-2-2-4 Numbers of firing incidents and persons killed in firing incidents (1996-2005) (2) Trends in clearance of offenses involving the use of firearms
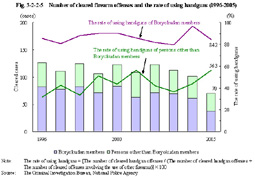
Fig. 3-2-2-5 shows the number of cleared firearm offenses and the rate of using handguns over the last 10 years.
Fig. 3-2-2-5 Number of cleared firearm offenses and the rate of using handguns (1996-2005) (3) Trends in seizure of handguns
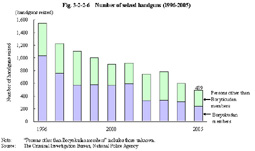
Fig. 3-2-2-6 shows the number of handguns seized over the last 10 years.
Fig. 3-2-2-6 Number of seized handguns (1996-2005) In 2005, the number of seized handguns decreased by 112 (18.6%) from the previous year to 489, among which real handguns were 440 (90.0%).Breaking down the countries of manufacture that manufactured the 440 real handguns seized in 2005, the U.S.A. had the largest share with 126, followed by Japan with 59, Belgium with 40, Russia with 38, China with 34, Philippines with 30, and Brazil with 22 (Source: The Criminal Investigation Bureau, National Police Agency). |


