| Previous Next Index Image Index Year Selection | |
|
|
The principal data on special act offenses (including violation of ordinances, hereinafter the same) in 2005 are as follows.
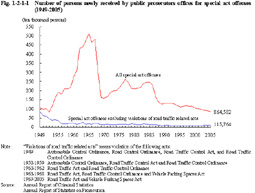
Principal data for 2005 (special act offenses) Number of persons newly (percent ratio) (year-on-year change) received by public prosecutors offices [1] Road Traffic Act violations 735,667 (85.1%) (-33,054) (-4.3%) [2] Stimulants Control Act violations 23,143 (2.7%) (+2,621) (+12.8%) [3] Immigration Control Act violations 14,357 (1.7%) (-464) (-3.1%) [4] Vehicle Parking Spaces Act violations 13,151 (1.5%) (-1,023) (-7.2%) [5] Minor Offenses Act violations 10,542 (1.2%) (-459) (-4.2%) [6] Wastes Disposal Act violations 6,777 (0.8%) (+1,269) (+23.0%) [7] Firearms and Swords Control Act violations 5,304 (0.6%) (+7) (+0.1%) [8] Automobile Liability Insurance Act violations 4,415 (0.5%) (+754) (+20.6%) [9] Adult Entertainment Act violations 4,111 (0.5%) (+693) (+20.3%) [10] Poisonous and Deleterious Substances 3,840 (0.4%) (-1,549) (-28.7%) Control Act violations Others 43,275 (5.0%) Total 864,582 (100.0%) (-28,676) (-3.2%) (Source: Annual Report of Statistics on Prosecution) Fig. 1-2-1-1 Number of persons newly received by public prosecutors offices for special act offenses (1949-2005)
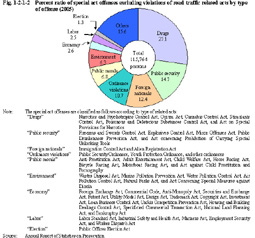
The total number of special act offenses decreased sharply when the traffic violation notification system came into force in July 1968 and remained on the range of 2 million persons through 1975 to 1984. The number decreased sharply again due to the expansion of the scope of this system in 1987 and has generally been on a declining trend. Meanwhile, the number of special act offenses excluding violations of road traffic related acts has been increasing since 2001. Fig. 1-2-1-2 shows the percent ratio of persons newly received by public prosecutors offices for special act offenses excluding violations of road traffic related acts in 2005. Fig. 1-2-1-2 Percent ratio of special act offenses excluding violations of road traffic related acts by type of offense (2005)
|