| Previous Next Index Image Index Year Selection | |
|
|
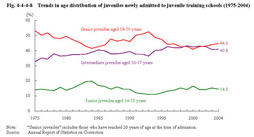
4 Characteristics of newly admitted inmates (1) Age Fig.4-4-4-8 shows the age distribution of juveniles newly admitted to juvenile training schools since1975.
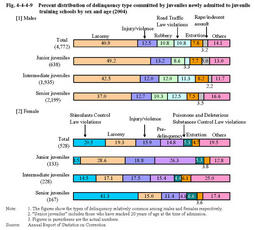
Fig.4-4-4-8 Trends in age distribution of juveniles newly admitted to juvenile training schools(1975-2004) (2) Type of delinquency Fig.4-4-4-9 shows the percent distribution of delinquency type committed by juveniles newly admitted to juvenile training schools in2004by sex and age group.
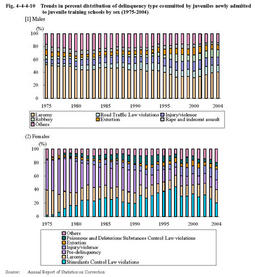
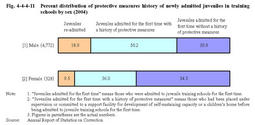
Fig.4-4-4-9 Percent distribution of delinquency type committed by juveniles newly admitted to juvenile training schools by sex and age(2004) For males,the percentage of larceny had been gradually declining from52.1%in1975to31.7%in2000,but has been on an upward trend in recent years,reaching40.9%in2004.The percentage of robbery has remained around10%since1997. For females,the percentage of pre-delinquency used to be high(45.4%in1975),but has decreased significantly,standing at14.8%in2004.The percentage of Stimulants Control Law violations had increased until1997(43.8%),but has been on a declining trend in recent years,down at20.5%in2004.The percentage of injury and physical violence has been on the rise recently,reaching15.9%in2004. Fig.4-4-4-10 Trends in percent distribution of delinquency type committed by juveniles newly admitted to juvenile training schools by sex(1975-2004) (3) History of protective measures Fig.4-4-4-11 shows the percent distribution of protective measures history of juveniles newly admitted to training schools in2004by sex.
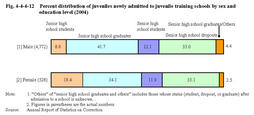
Juveniles admitted for the first time(those admitted to juvenile training schools for the first time;hereinafter the same in this Section)accounted for81.1%of males and90.5%of females. Fig.4-4-4-11 Percent distribution of protective measures history of newly admitted juveniles in training schools by sex(2004) (4) Education level,etc. Fig.4-4-4-12 shows the percent distribution of juveniles newly admitted to juvenile training schools in2004by education level and by sex.
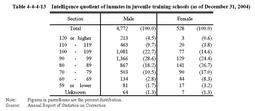
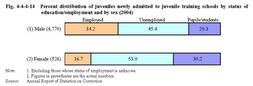
Fig.4-4-4-12 Percent distribution of juveniles newly admitted to juvenile training schools by sex and education level(2004) Table4-4-4-13 Intelligence quotient of inmates in juvenile training schools(as of December31,2004) (5) Status of education or employment Fig.4-4-4-14 shows the percent distribution of juveniles newly admitted to juvenile training schools in2004by status of education or employment.
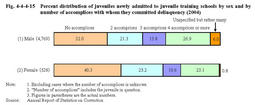
Those unemployed accounted for46.2%of the total,while those employed accounted for32.5%. Fig.4-4-4-14 Percent distribution of juveniles newly admitted to juvenile training schools by status of education/employment and by sex(2004) (6) Relationship with delinquent groups and accomplices Fig.4-4-4-15 shows the percent distribution of juveniles newly admitted to juvenile training schools in2004by the number of accomplices with whom they committed delinquency and by sex.
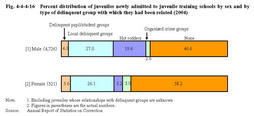
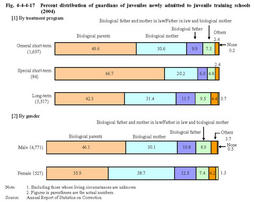
According to a breakdown by the relationship with accomplices,both males and females were most likely to commit delinquency with their friends(41.7%males and36.9%females),followed by members of delinquent groups(18.5%males and5.9%females)(Source:Annual Report of Statistics on Correction). Fig.4-4-4-15 Percent distribution of juveniles newly admitted to juvenile training schools by sex and by number of accomplices with whom they committed delinquency(2004) Fig.4-4-4-16 Percent distribution of juveniles newly admitted to juvenile training schools by sex and by type of delinquent group with which they had been related(2004) (7) Guardians Fig.4-4-4-17 shows the percent distribution of guardians of juveniles newly admitted to juvenile training schools in2004,by treatment program and sex.
Fig.4-4-4-17 Percent distribution of guardians of juveniles newly admitted to juvenile training schools(2004) |