| Previous Next Index Image Index Year Selection | |
|
|
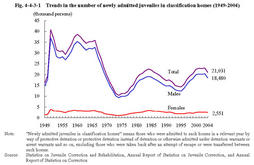
2 Admission and discharge (1) Number of newly admitted juveniles in classification homes Fig.4-4-3-1 shows the number of juveniles newly admitted to juvenile classification homes since1949(see Appendix4-11 ).
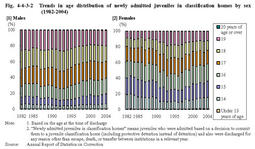
Fig.4-4-3-1 Trends in the number of newly admitted juveniles in classification homes(1949-2004) Among newly admitted juveniles in2004,those admitted by way of protective detention accounted for85.9%and those by protective detention instead of detention accounted for10.8%of the total.There were also very few juveniles admitted by way of detention or custody,etc.(Source:Annual Report of Statistics on Correction).(2) Characteristics of newly admitted juveniles a. Age Fig.4-4-3-2 shows the age distribution of newly admitted juveniles in classification homes since1982by sex.
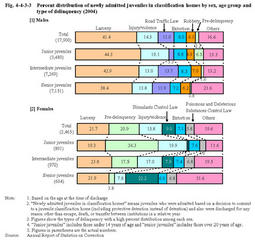
Females are more likely to be admitted at a younger age compared to males.The rate of senior juveniles has been on a declining trend,while that for younger juveniles has been on a rise for both males and females. Fig.4-4-3-2 Trends in age distribution of newly admitted juveniles in classification homes by sex(1982-2004) b. Type of delinquency Fig.4-4-3-3 shows the percent distribution of newly admitted juveniles in classification homes in2004,by the type of delinquency and by sex.
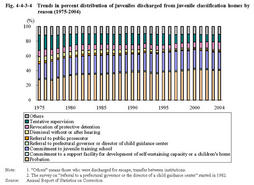
The rate of larceny was the highest among male juveniles in all age groups.For females,pre-delinquency has decreased,while an increase was observed in the rate of Stimulants Control Law violations. Fig.4-4-3-3 Percent distribution of newly admitted juveniles in classification homes by sex,age group and type of delinquency(2004) (3) Reasons for discharge Fig.4-4-3-4 shows the number of juveniles discharged from juvenile classification homes over the last30years,by reason.
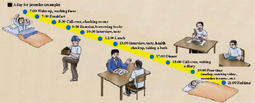
Probation was the most common reason,followed by commitment to a juvenile training school.Recently the percentage of probation has been on the rise,but that of tentative supervision by a family court probation officer has decreased,becoming lower than cancellation of protective detention in2003.In2004,9,206juveniles(40.4%)were discharged from juvenile classification homes for probation,330(1.4%)for commitment to a support facility for development of self-sustaining capacity or a children's home,5,307(23.3%)for commitment to a juvenile training school,124(0.5%)for referral to a prefectural governor or the director of a child guidance center,381(1.7%)for referral to a public prosecutor,370(1.6%)for dismissal without or after hearing,2,335(10.2%)for cancellation of protective detention,and2,308(10.1%)for tentative supervision. Fig.4-4-3-4Trends in percent distribution of juveniles discharged from juvenile classification homes by reason(1975-2004) Life in juvenile classification homesJuveniles accommodated in juvenile classification homes lead life as described below.Rooms for juveniles are determined considering sex,age,character,career,history of entering such homes,complicity relationships,etc. In juvenile classification homes,juveniles first are to restore a healthy lifestyle by leading an orderly life in a bright and quiet environment.Juveniles are apt to feel worried about their disposition before their hearings,so each home tries to eliminate those worries to have them be calmly prepared for their hearings. |
