| Previous Next Index Image Index Year Selection | |
|
|
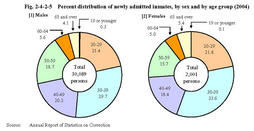
4 Characteristics of newly admitted inmates (1) Age Fig.2-4-2-5 shows the percent distribution of newly admitted inmates in2004by sex and by age group.
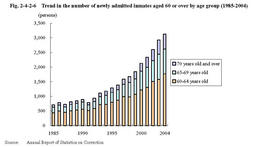
Fig.2-4-2-5 Percent distribution of newly admitted inmates,by sex and by age group(2004) Fig.2-4-2-6 shows the trend of the number of newly admitted inmates aged60or over by age group,over the last20years. Fig.2-4-2-6 Trend in the number of newly admitted inmates aged60or over by age group(1985-2004) (2) Type of offenses In examination of offenses committed by newly admitted inmates in2004,the following five offenses had high percentages for male inmates:(1)larceny(30.0%),(2)Stimulants Control Law violations(18.1%),(3)Road Traffic Law violations(7.0%),(4)fraud(7.0%),and(5)injury(6.0%).The following five offenses had high percentages for female inmates:(1)Stimulants Control Law violations(35.4%),(2)larceny(28.4%),(3)fraud(9.2%),(4)homicide(4.3%),and(5)Road Traffic Law violations(3.6%)(see Appendix2-7 ).
For male inmates,larceny accounted for the highest percentage,followed by Stimulants Control Law violations.This pattern has continued since1998. For female inmates,the percentage for Stimulants Control Law violations has been the highest since1978.Although its actual number has remained almost the same since1998,the percent distribution has been on a declining trend due to increases in other offenses. (3) Type of sentence and term of imprisonment By type of sentence of newly admitted inmates in2004,99.2%(31,841inmates)were sentenced to imprisonment with labor,and the rest of them were sentenced to imprisonment without labor(0.7%or212inmates),or penal detention(0.1%or35inmates).A death penalty was executed for two inmates in2004.
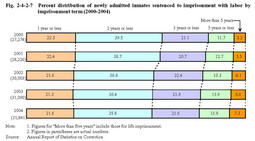
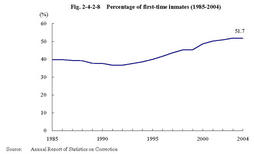
Fig.2-4-2-7 shows the percent distribution of newly admitted inmates sentenced to imprisonment with labor by imprisonment term over the last five years.Percent distribution of"more than one year but two years or less"inmates is the highest of all every year,but has been on a declining trend,and that of sentenced to imprisonment for more than two years has been on an increasing trend(see Appendix2-11 for the trend of inmates imprisoned with labor by imprisonment term,as of the end of each year). Fig.2-4-2-7 Percent distribution of newly admitted inmates sentenced to imprisonment with labor by imprisonment term(2000-2004) (4) Trend in percent age of first-time inmates Fig.2-4-2-8 shows the percentage of first-time inmates(persons imprisoned for the first time)in all those newly admitted over the last20years.
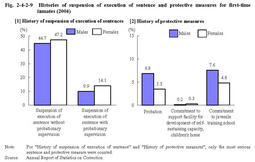
Fig.2-4-2-8 Percentage of first-time inmates(1985-2004) (5) History of suspension of execution of sentence and protective measures for first-time inmates Fig.2-4-2-9 shows the histories of suspension of execution of sentence and protective measures of the16,591first-time inmates(15,158males and1,433females)newly imprisoned in2004.
Fig.2-4-2-9 Histories of suspension of execution of sentence and protective measures for first-time inmates(2004) (6) Frequency of imprisonment Of all offenders newly imprisoned in2004,repeat convicts(those who had previously been imprisoned once or more;hereinafter the same)accounted for48.3%.By type of offense,repeat convicts were most frequently found in those imprisoned for larceny for males(33.2%)and Stimulants Control Law violations for females(48.9%)(see Appendixes2-8 .).
Those inmates who had previously been imprisoned five times or more accounted for17.0%of the total,among which those imprisoned for larceny and Stimulants Control Law violations accounted for61.4%(see Appendixes2-9 ). |