| Previous Next Index Image Index Year Selection | |
|
|
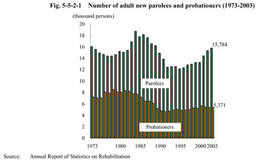
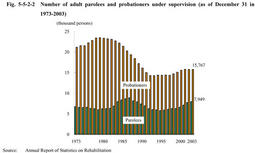
1. Trends in adult parolees and probationers (1) Number of adult parolees and probationers Fig. 5-5-2-1 shows trends in the numbers of adult parolees and probationers newly placed under supervision(hereinafter referred to as"new parolees"and"new probationers")since1973. Fig. 5-5-2-2 shows their numbers under supervision at the end of each year.
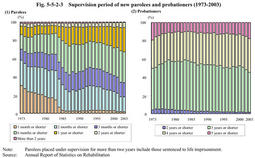
The number of new parolees has risen since1996,to15,784 in 2003. On the other hand,the number of new probationers has been around4,000to 5,000since 1989,at 5,371 in 2003.While those persons sentenced to imprisonment and those sentenced to suspended imprisonment without supervision have increased,only those sentenced to suspended imprisonment with supervision has leveled off. The numbers of adult parolees and adult probationers under supervision were7,949and15,767,respectively,as of December31,2003.More probationers are under supervision than parolees because the supervision periods of probationers are usually much longer than those of parolees. Fig. 5-5-2-1 Number of adult new parolees and probationers(1973-2003) Fig. 5-5-2-2 Number of adult parolees and probationers under supervision(as of December31in1973-2003) (2) Supervision period Fig. 5-5-2-3(1) shows a breakdown of new parolees since1973by parole supervision period.Those parolees with one month or shorter parole period had decreased since1984when the measures for appropriate and active use of parole were implemented(see this part, Chapter4,Section2,2 ),and the percentage of those with a relatively long period has risen since1994.However,in2003,those parolees with one year or shorter supervision still accounted for93.9%and those with six months or shorter accounted for67.4%.A short period supervision is much more common among parolees compared with probationers.
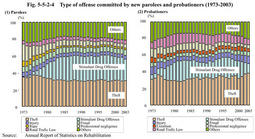
Fig. 5-5-2-3(2) shows a breakdown of new probationers by probation supervision period.Those probationers with supervision period between three and four years have always accounted for about80%.Still more,the percentage of those with five year supervision has risen since2001,accounting for17.6%in2003. Fig. 5-5-2-3Supervision period of new parolees and probationers(1973-2003) (3) Type of offense Fig. 5-5-2-4(1) shows a breakdown of new parolees since1973by major offense which were in the top five offenses in1973or2003.Theft has always taken the largest share.The number of parolees who violated the Stimulant Drug Control Law jumped from92in1973to4,025in2003.
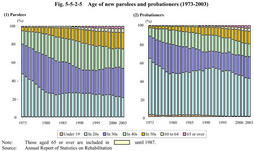
Fig. 5-5-2-4(2) shows the same breakdown of new probationers by major offense.As is the case with parolees,theft has always had the largest share.Those for Stimulant Drug Control Law violations stayed high during the period from1975to1998,but have declined for the past several years. Fig. 5-5-2-4 Type of offense committed by new parolees and probationers(1973-2003) (4) Age Fig. 5-5-2-5(1) shows a breakdown of new parolees since1973by age group.
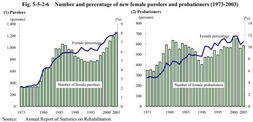
Parolees are aging as prisoners are graying.The percentage of those aged60or over jumped from0.9%in1973to6.9%in2003.In2003,new parolees aged65or over accounted for2.8%. Fig. 5-5-2-5(2) shows a breakdown of new probationers by age group.They are also aging but are generally young compared with parolees. Fig. 5-5-2-5 Age of new parolees and probationers(1973-2003) (5) Female parolees and probationers Fig. 5-5-2-6 shows the number and percentage of new female parolees and probationers since1973.Female percentage has been on the rise from a long-term standpoint,reaching8.0%of parolees and10.9%of probationers in 2003.
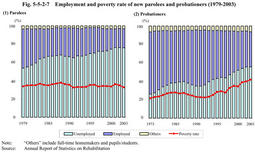
Common offenses among females were Stimulant Drug Control Law violations and theft.In2003,567female parolees had committed stimulant drug offenses and317theft out of the total of1,260,while204female probationers had committed theft and196stimulant drug offenses out of the total of586(Source:Annual Report of Statistics on Rehabilitation). Fig. 5-5-2-6 Number and percentage of new female parolees and probationers(1973-2003) (6) Employment and poverty rate Fig. 5-5-2-7(1) shows the employment and poverty rate of new parolees at the beginning of parole supervision since1979.
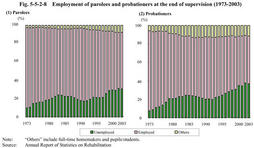
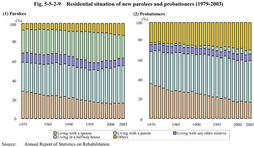
The percentage of those unemployed at the beginning of supervision has risen from53.6%in1979to75.9%in2003.On the other hand,the percentage of those classified as"poor"(classified by a probation officer)at the beginning of supervision has shown no significant change,standing at30%to39%. Fig. 5-5-2-7(2) shows the employment and the poverty rate of new probationers at the beginning of probation supervision since1979.The proportion of those unemployed jumped from26.1%in1979to55.6%in2003,showing a sharp upward although they are much smaller in number compared with parolees.Their poverty rate has also increased considerably. The increasing unemployed rate at the beginning of supervision both among parolees and probationers has made it especially important to secure employment for them. Fig. 5-5-2-7 Employment and poverty rate of new parolees and probationers(1979-2003) Fig. 5-5-2-8 Employment of parolees and probationers at the end of supervision(1973-2003) (7) Residential situation at the beginning of supervision Fig. 5-5-2-9 shows a breakdown of new parolees and probationers by residential situation at the beginning of supervision since1979.Among both parolees and probationers,the percentage of those who live with their spouses has been on the decline.
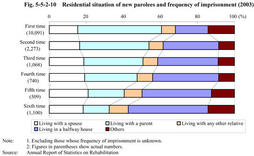
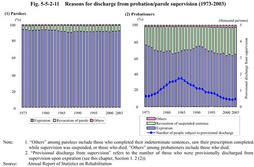
Parolees were more likely to live in halfway houses than probationers.In2003,3,738parolees went to halfway houses from prisons,accounting for23.7%of the total parolees released.Since1998,however,parolees going to halfway houses have decreased in proportion. Fig. 5-5-2-9 Residential situation of new parolees and probationers(1979-2003) Fig. 5-5-2-10 Residential situation of new parolees and frequency of imprisonment(2003) (8) Reasons for discharge from supervision Fig. 5-5-2-11(1) shows a breakdown of the parolees who were discharged from supervision since1973by reason for discharge.
Each year,about90-95%of parolees were discharged from supervision upon the expiration of their sentencing term.The percentage was92.6%in2003.On the other hand,about4-8%of them were discharged due to parole revocation.In2003,the percentage was6.6%. Those parolees who had been imprisoned and paroled for theft and stimulant drug offenses were large in number among those whose parole was revoked,accounting for51.4%and25.7%respectively,more than three quarters put together,in2003(Source:Annual Report of Statistics on Rehabilitation). Fig. 5-5-2-11(2) shows a breakdown of probationers who were discharged from supervision since1973by reason for discharge.Each year,about62-75%probationers were discharged from supervision upon the expiration of term.The percentage was64.3%in2003.About22-34%were discharged due to revocation of suspended sentence.In2003,the percentage was33.0%.The percentage of those probationers discharged upon expiration was smaller than that of parolees,probably because the probation periods were usually longer than parole periods and also because probationers were less appreciative of probation and less motivated to successfully complete their probation periods compared with parolees who had experienced imprisonment. Similarly to parolees,those who were put on probation for theft and stimulant drug offenses were the majority of those whose probation was revoked,accounting for43.2%and18.7%respectively in2003(Source:Annual Report of Statistics on Rehabilitation). Fig. 5-5-2-11 Reasons for discharge from probation/parole supervision(1973-2003) |