| Previous Next Index Image Index Year Selection | |
|
|
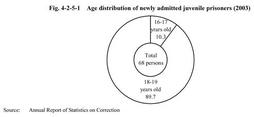
2. Number and characteristics of juvenile prisoners The number of newly admitted juvenile prisoners was1,021in1966when keeping of statistics on juvenile prisoners was started.It decreased to403in1970,173in1975,99in1986,and to41in1996.Since then,it was in minor fluctuations and has decreased to68in2003from87in the previous year.All the68juveniles were males and their ages are shown in Fig. 4-2-5-1. No juvenile prisoners were under16years of age in2003,as was the case in the previous year.
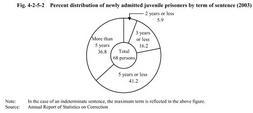
Fig. 4-2-5-2 shows the percent distribution by term of sentence of newly admitted juvenile prisoners in2003.All the68juveniles received indeterminate sentences in2003,while83out of87juvenile prisoners received such a sentence in the previous year. All of the prisoners were sentenced to imprisonment with labor,as was the case in the previous year. By type of offense,63juveniles committed penal code offenses,while the other five committed special law offenses.The most common offense was injury committed by16juveniles(two juveniles committed injury,and14committed injury resulting in death),followed by robbery committed by15juveniles(two robbery,nine robbery resulting in death or injury,and four rape on the occasion of robbery or rape on the occasion of robbery resulting in death),rape and rape resulting in death or injury committed by10juveniles,professional negligence resulting in death or injury committed by seven juveniles,unsafe driving resulting in death or injury in traffic accident committed by six juveniles,and homicide committed by two juveniles(Source:Annual Report of Statistics on Correction). Fig. 4-2-5-1 Age distribution of newly admitted juvenile prisoners(2003) Fig. 4-2-5-2 Percent distribution of newly admitted juvenile prisoners by term of sentence(2003) |