| Previous Next Index Image Index Year Selection | |
|
|
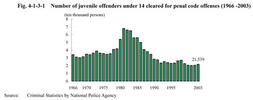
Fig. 4-1-3-1 shows the number of juvenile offenders under14cleared for penal code offenses since1966.The number had been on the decline after a peak of67,906in1981,but has increased for two years since2002,reaching21,539in2003.
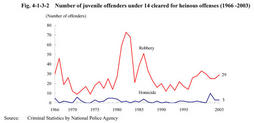
Fig. 4-1-3-1 Number of juvenile offenders under14cleared for penal code offenses(1966-2003) Fig. 4-1-3-2 shows the number of juveniles under14cleared for homicide and robbery since1966(see Appendix4-3 for other major type of offense).The number of those cleared for homicide had been low until2000,below six.After jumping to10in2001,it fell to three in2003.The number of those for robbery after peaking in the early1980s remained about the same,but slightly has increased since1997,reaching 29 in 2003.Fig. 4-1-3-2 Number of juvenile offenders under14cleared for heinous offenses(1966-2003) |

