| Previous Next Index Image Index Year Selection | |
|
|
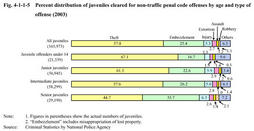
3. Trend in type of offense Fig. 4-1-1-5 shows the percent distribution of juveniles cleared for non-traffic penal code offenses in2003by type of offense.The largest portion consisted of those cleared for theft at57.8%,followed by embezzlement(25.4%),almost100%of which was made up of misappropriation of lost property.Viewed by age group,the percentage for theft was the highest in all age groups,and as high as67.1%in those juveniles under14in particular(see Appendix4-3 ).
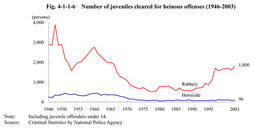
Fig. 4-1-1-5 Percent distribution of juveniles cleared for non-traffic penal code offenses by age and type of offense(2003) Fig. 4-1-1-6 shows the number of juveniles cleared for homicide or robbery since1946(see Appendixes4-3and4-4for other major penal code offenses).Juveniles cleared for homicide had remained over100since1998,but decreased to83in2002and96in2003.Those cleared for robbery was over1,000in1996and dramatically increased to1,701in1997.Since then,they have remained at a high level,reaching1,800in2003,the highest since1967.Fig. 4-1-1-6 Number of juveniles cleared for heinous offenses(1946-2003) |

