| Previous Next Index Image Index Year Selection | |
|
|
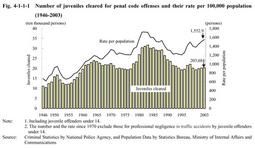
1. Number of juveniles cleared Fig. 4-1-1-1 shows the number of juveniles cleared for penal code offenses and their rates per100,000juveniles aged10and over but less than20since1946(see Appendix4-1 ).The number of juveniles cleared for penal code offenses had three peaks in1951at166,433,in1964at238,830,and in1983at317,438.
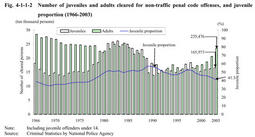
Juveniles cleared and their rate per population,which were in upward trends since1996,went down in1999and2000,but have increased again since2001to203,684(up0.6%from the previous year)and1,552.9persons per100,000juveniles in2003. Fig. 4-1-1-1 Number of juveniles cleared for penal code offenses and their rate per100,000population(1946-2003) The number of juveniles cleared for non-traffic penal code offenses increased from1975,and formed a big wave until1989.After some fluctuation,it was165,973(up2.3%from the previous year)in 2003.The juvenile proportion to the persons cleared has been on the decline due to an increase of adults cleared since1998,and stood at41.3%in2003. Fig. 4-1-1-2 Number of juveniles and adults cleared for non-traffic penal code offenses,and juvenile proportion(1966-2003) |