| Previous Next Index Image Index Year Selection | |
|
|
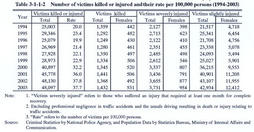
2. FatalandBodilyDamage Table 3-1-1-2 shows the trends of victims who were killed or injured in non-traffic penal code offenses and their rate per100,000persons over the last10years since1994.In2003,the total number of the persons killed or injured was48,097(a decrease of33from the previous year).Among them,those killed were1,432(a decrease of64),those severely injured were3,731(an increase of76),and those slightly injured were42,934(a decrease of173).Over the last10years,the number of victims killed has not changed much,while victims severely injured have increased since1997.The number of victims slightly injured has declined slightly from the previous year in2003,but is still on an increasing trend.The percentage of female victims was32.5%in1994and37.1%in2003for those killed,18.7%in1994and25.6%in2003for those severely injured,and21.9%in1994and28.9%in2003for those slightly injured.
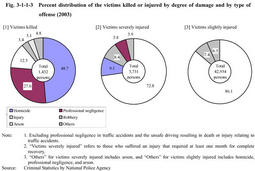
Table 3-1-1-2 Number of victims killed or injured and their rate per100,000persons(1994-2003) Fig. 3-1-1-3Percent distribution of the victims killed or injured by degree of damage and by type of offense(2003) |