| Previous Next Index Image Index Year Selection | |
|
|
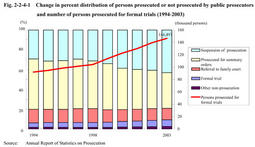
Fig. 2-2-4-1 shows the change in percentage distribution of persons prosecuted or not prosecuted by public prosecutors and the number of persons prosecuted for formal trials in the last10years.
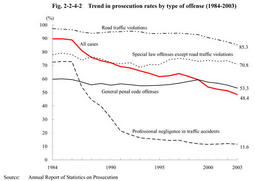
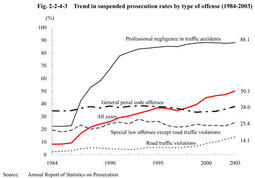
Fig. 2-2-4-1 Change in percent distribution of persons prosecuted or not prosecuted by public prosecutors and number of persons prosecuted for formal trials(1994-2003) Persons prosecuted for formal trials have increased continuously for the last nine years.In2003,they have increased by7,017since2002,by54,504since1994.The percentage of prosecution for formal trials has also increased gradually,from4.3%in1994to6.7%in2003(see Appendix2-2 ). Fig. 2-2-4-2 and Fig. 2-2-4-3 show trends in prosecution rate and suspended prosecution rate over the last20years by type of offense.Prosecution rate was48.4%and suspended prosecution rate was50.1%in2003.For overall cases,prosecution rate has been on a downward trend while suspended prosecution rate has been on an upward trend.For non-traffic penal code offenses,both rates have been as stable as the prosecution rate of between50%and60%and suspended prosecution rate of between30%and40%(see Appendix2-3 ). Fig. 2-2-4-2Trend in prosecution rates by type of offense(1984-2003) Fig. 2-2-4-3Trend in suspended prosecution rates by type of offense(1984-2003) Table 2-2-4-4 Number of suspects who were not prosecuted,by reason(1994-2003) Quasi-prosecution procedure: Under this system,the complainant or accuser who is dissatisfied with the non-prosecution disposition for abuse of authority of public officials decided by the public prosecutor can apply for committing the case to a court for trial.The court shall decide to commit the case for trial when the court considers it as appropriate,thereby a prosecusion is deemed to be instituted.This system is also called the system of application for committing a case to a court for trial. Prosecution rate: This is an indication of the following as a percentage:number of suspects prosecuted/(number of suspects prosecuted+number of suspects not prosecuted).The number of suspects prosecuted includes suspects prosecuted both for formal trials and for summary orders. Suspended prosecution rate: This is an indication of the following as a percentage:number of suspects granted suspension of prosecution/(number of suspects prosecuted+number of suspects granted suspension of prosecution).It does not include suspects who were not prosecuted for a reason other than suspension of prosecution.The suspended prosecution rate shows what percentage of suspects was granted suspension of prosecution among those whose guilty were deemed sufficiently proved. |