Previous     Next            Index     Image Index     Year Selection
 White paper on crime 2004 Part1/Chapter2/Section1/2. 

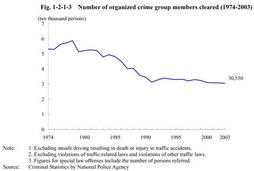
2. Trends in offenses by organized crime groups

  Fig. 1-2-1-3 shows the number of organized crime group members cleared for non-traffic penal code offenses and special law offenses(excluding unsafe driving resulting in death or injury in traffic accidents,violations of traffic-related laws,and violations of other traffic laws;hereinafter the same in this subsection)since1974.Those members cleared were stable between30,000and40,000since1991,and30,550in2003,decrease of274from2002.Among them,10,110persons were regular members,up203from2002.

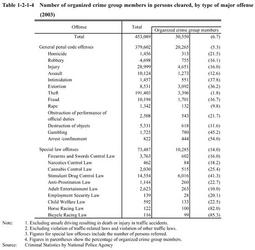
Fig. 1-2-1-3 Number of organized crime group members cleared(1974-2003)

  Table 1-2-1-4 shows the number of organized crime group members included in total persons cleared for non-traffic penal code offenses and special law offenses in2003,by type of major offense.Among those group members cleared in2003,20,265(down140from2002)were for non-traffic penal code offenses,and10,285(down134from2002)were for special law offenses.They had large shares for intimidation,extortion,gambling,arrest/confinement,Stimulant Drug Control Law violations,Horse Racing Law violations,and Bicycle Racing Law violations.Of organized crime group members cleared,Stimulant Drug Control Law violations were the highest at19.7%(6,016persons),followed by injury at15.2%(4,651persons),theft at11.1%(3,396persons),and extortion at10.1%(3,092persons).

Table 1-2-1-4 Number of organized crime group members in persons cleared,by type of major offense(2003)