| Previous Next Index Image Index Year Selection | |
|
|
1. Outline The principal data on penal code offenses in2003are as follows.
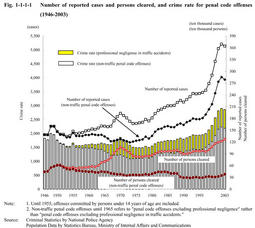
Non-traffic penal code offenses refer to penal code offenses excluding professional negligence in traffic accidents . Principal data on penal code offenses,2003 (year-on-year change) [1] Reported cases Penal code offenses3,646,253(-47,675)(-1.3%) Non-traffic penal code offenses2,790,444(-63,617)(-2.2%) Non-traffic penal code offenses excluding554,600(+78,027)(+16.4%) theft [2] Cleared cases Penal code offenses1,504,436(+71,888)(+5.0%) Non-traffic penal code offenses648,627(+55,946)(+9.4%) Non-traffic penal code offenses excluding214,709(+25,900)(+13.7%) theft [3] Persons cleared Penal code offenses1,269,785(+50,221)(+4.1%) Non-traffic penal code offenses379,910(+32,030)(+9.2%) Non-traffic penal code offenses excluding188,507(+21,352)(+12.8%) theft [4] Crime rate Penal code offenses2,857(-42) Non-traffic penal code offenses2,187(-53) Non-traffic penal code offenses excluding435(+61) theft [5] Clearance rate Penal code offenses41.3(+2.5points) Non-traffic penal code offenses23.2(+2.5points) Non-traffic penal code offenses excluding38.7(-0.9points) theft (Source:Criminal Statistics by National Police Agency) *"Crime rate"means the number of reported cases per100,000persons. Fig. 1-1-1-1 shows the number of reported cases and persons cleared,and crime rates for penal code offenses and non-traffic penal code offenses since1946(see Appendix1-1 ). Fig. 1-1-1-1 Number of reported cases and persons cleared,and crime rate for penal code offenses(1946-2003) (1) Reported cases and crime rate The number of reported cases for penal code offenses had continued to increase sharply,registering a new postwar high every year for seven years from1996.In2003,however,it decreased by47,675(1.3%)from the previous year to3,646,253for the first time in nine years,but still remaining at a high level over the overall postwar period.By type of offence,the number for theft decreased by141,644(6.0%)from the previous year,which is a major cause of the overall decline.The crime rate for penal code offenses has shown almost the same trend,reaching2,857in2003.
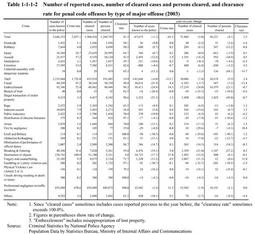
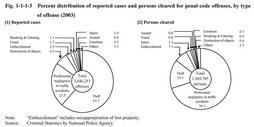
Table 1-1-1-2 and Fig. 1-1-1-3[1] show the number of reported cases for penal code offenses by type of offense,in which theft has the largest share,followed by professional negligence in traffic accidents,destruction of objects,embezzlement(including misappropriation of lost property),fraud,and breaking and entering. Table 1-1-1-2 Number of reported cases,number of cleared cases and persons cleared,and clearance rate for penal code offenses by type of major offense(2003) Fig. 1-1-1-3 Percent distribution of reported cases and persons cleared for penal code offenses,by type of offense(2003) (2) Persons cleared The number of persons cleared for penal code offenses has been generally on the rise since1992.In2003,it reached1,269,785,registering a new postwar high every year for five years. Table 1-1-1-2 and Fig. 1-1-1-3[2] show the number of persons cleared in2003,by type of offense.Professional negligence in traffic accidents has the largest share,followed by theft,embezzlement(including misappropriation of lost property),injury,fraud,and assault.
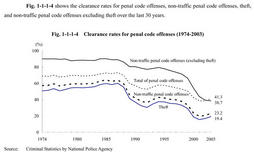
(3) Clearance rate Fig. 1-1-1-4 shows the clearance rates for penal code offenses,non-traffic penal code offenses,theft,and non-traffic penal code offenses excluding theft over the last30years.
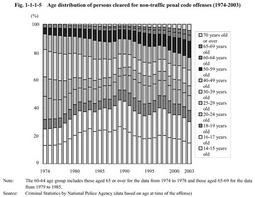
Fig. 1-1-1-4 Clearance rates for penal code offenses(1974-2003) (4) Age distribution of persons cleared Fig. 1-1-1-5 shows the age distribution of persons cleared for non-traffic penal code offenses over the last30years.It indicates a characteristic tendency that the share of those aged60or over has increased from2.5%in1974to12.2%in2003due to the aging of the total population.The share of those aged65or over was7.8%in2003.
Fig. 1-1-1-5 Age distribution of persons cleared for non-traffic penal code offenses(1974-2003) |