| Previous Next Index Image Index Year Selection | |
|
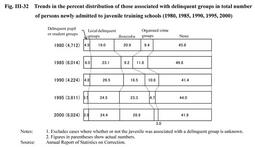
|
3. Characteristics of newly admitted juveniles (1)Age at time of admission
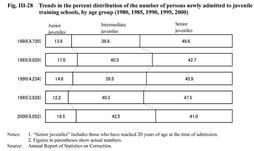
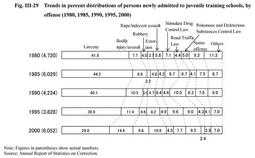
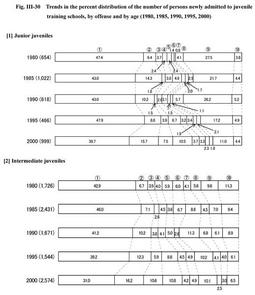
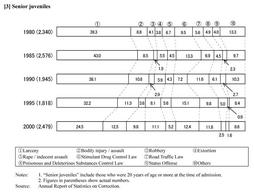
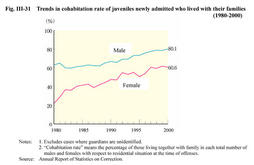
Fig. III-28 shows the trends in the percent distribution of juveniles newly admitted since 1980, by age group every five year. Although senior juveniles traditionally had the largest share, the percentage of intermediate juveniles has been rising in recent years and slightly exceeded that of senior juveniles in 2000. Fig. III-28 Trends in the percent distribution of the number of persons newly admitted to juvenile training schools, by age group (1980, 1985, 1990, 1995, 2000) (2)Type of offense The percent distributions by offense of juveniles newly admitted since 1980 on a five-year basis are shown in Fig. III-29 . The percent distribution of larceny was largest in each year, but has been on a downward trend. The percent distribution of bodily injury/assault, robbery and extortion are on the rise. Fig. III-29 Trends in percent distributions of persons newly admitted to juvenile training schools, by offense (1980, 1985, 1990, 1995, 2000) By gender, the percent distribution of larceny is highest for males newly admitted in 2000 (31.7%), followed by bodily injury/assault (14.9%) and extortion (11.2%). The percent distribution of Stimulant Drug Control Law violations was highest among females (33.9%), followed by status offense (16.9%), larceny (12.7%) (see Appendix III-13 ). Fig. III-30 Trends in the percent distribution of the number of persons newly admitted to juvenile training schools, by offense and by age (1980, 1985, 1990, 1995, 2000) (3)Foreign juveniles Of those newly admitted to juvenile training schools in 2000, 38 juveniles (37 males, 1 female) were placed in the living guidance course (G2) as foreign nationals who need treatment programs different from Japanese nationals. By nationality, Brazilians (30 persons) had the largest share. By age, 19-year-olds accounted for the largest share (12 persons), followed by 18-year-olds (11 persons), and 17-year-olds (8persons). By offense, larceny was most prevalent (17 persons), followed by robbery (10 persons), and Stimulant Drug Control Law violations (3 persons) (Source:Annual Report of Statistics on Correction). (4)Others [1]50.8% of juveniles newly admitted in 2000 (51.7% for males and 43.0% for females) had their natural mother and father as guardians, but the percentage was lower for females than for males. Fig. III-31 shows the percentage of juveniles newly admitted since 1980, who lived with their families at the time of delinquency by gender. In general, the percentage has tended to rise for both genders, and especially the percentage of females rose from 22.0% in 1980 to 60.6% in 2000, representing an almost threefold increase. [2] Fig. III-32 shows the percentage of those associated with delinquent groups in the total number of persons newly admitted to juvenile training schools since 1980, on a five-year basis. The percentage of local delinquent groups accounts for about 20%. Meanwhile, the percentage of bosozoku (motorcycle gangs)has risen since 1990. Fig. III-31 Trends in cohabitation rate of juveniles newly admitted who lived with their families (1980-2000) Fig. III-32 Trends in the percent distribution of those associated with delinquent groups in total number of persons newly admitted to juvenile training schools (1980, 1985, 1990, 1995, 2000) [3]21.8% of juveniles newly admitted in 2000 used drugs at the time of delinquency (18.8% for males and 48.9% for females). By type of drug and by gender, among males, organic solvents were most frequently used (12.0%), followed by stimulant drugs (6.0%). On the other hand, among females, the use of stimulant drugs was most prevalent (36.7%), followed by organic solvents (11.4%). [4] Fig. III-33 shows the trends in percent distribution of persons newly admitted to juvenile training schools by number of accomplices in 1982 when the statistics started being collected and every five years since 1985. This reveals that offenses are increasingly committed by four or more juveniles, while the percent distribution of juveniles who act alone in committing offenses has been declining. Also, as for the relationship with accomplices, friends were the most frequent accomplices in each year. However, the percentage of delinquent groups has risen recently. 67.6% of juveniles newly admitted in 2000 had accomplices (68.9% for males, and55.7% for females). Friends were the most frequent accomplices, accounting for 53.3% of the juveniles who had accomplices (52.7% for males and 59.2% for females). [5]Of those newly admitted to juvenile training schools in 2000, the percentage of those who are unemployed was 49.2% (48.6% for males and 54.8% for females), and the percentage of students and pupils was 19.8% (18.9% for males and 28.1% for females). [6] Fig. III-34 shows the trends in percent distribution of persons newly admitted to juvenile training schools, by educational level for every five years since 1980. The percent distribution for junior high school graduates has been on a downward trend since 1995. The percent distribution of senior high school dropouts has been on the rise. Also, the percent distribution of senior high school students, at 1.9% in 1980, increased about fivefold to 9.8% in 2000. Fig. III-33 Trends in the percent distribution of the number of persons newly admitted to juvenile training schools, by number of accomplices (1982, 1985, 1990, 1995, 2000) Fig. III-34 Trends in the percent distribution of the number of persons newly admitted to juvenile training schools, by educational level (1980, 1985, 1990, 1995, 2000) |