| Previous Next Index Image Index Year Selection | |
|
|
2. Admission and discharge (1)Admission
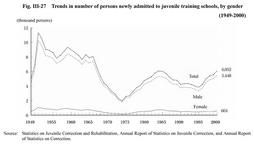
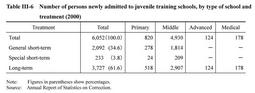
Trends in the number of persons newly admitted to juvenile training schools since 1949 are shown in Fig. III-27 . Newly admitted juveniles decreased gradually from 1985 but have been increasing since 1996. Fig. III-27 Trends in number of persons newly admitted to juvenile training schools, by gender (1949-2000) Table III-6 shows juveniles newly admitted by type of juvenile training school and treatment. Table III-6 Number of persons newly admitted to juvenile training schools, by type of school and treatment (2000) (2)Discharge 5,484 persons were discharged from juvenile training schools in 2000, of whom 97.7% (5,357 persons)were released on parole. 33.9% of those discharged found jobs, 45.4% were seeking employment, 9.6% wished to enter schools at higher levels, 2.1% returned to junior high schools and 3.0% returned to senior high school. Only 5.1% were discharged with no prospects for subsequent education or employment. The average detention period of those released on parole was 380 days for long-term treatment, 148 days for general short-term treatment, and 80 days for special short-term treatment (Source:Annual Report of Statistics on Correction). |