| Previous Next Index Image Index Year Selection | |
|
|
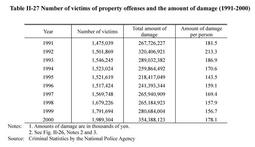
2. Property damage Table II-27 shows the trends in the number of victims, the total amount of property damage and the amount of property damage per victim in property offenses (referring to, for the purpose of this Section, robbery, extortion, larceny, fraud, and embezzlement including misappropriation of lost property)reported by the police over the last ten years since 1991.
The number of victims had been on a gradual rise since 1991, leveled off in 1994, and took an upward turn in 1997. In 2000, it increased by 197,610 (11.0%) from the previous year. The total and per-capita amounts of damage had both been on the decline since 1993, but started to increase in 1996, with minor degrees of increase and decrease. In 2000, the total amount of damage increased by 26.3% and the per-capita amount by 13.7% from the previous year. Table II-27 Number of victims of property offenses and the amount of damage (1991-2000) |
