| Previous Next Index Image Index Year Selection | |
|
|
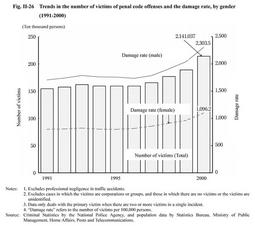
Fig. II-26 shows the trends in the number of victims of penal code offenses (excluding professional negligence in traffic accidents for the purpose of this Section)reported by the police over the last ten years since 1991 and the damage rate (number of crime victims per 100,000 people) in the case of victims being individuals.
The number of victims had been on a flat trend in recent years, but it started to increase in 1996 for female victims and in 1997 for male victims. In 2000, the total number of victims surpassed the 2.1 million mark, with an increase of 251,444 (13.3%) from the previous year. The damage rate had remained at the 1,700 level for male victims and the 800 level for female victims since 1991. However, it has been increasing for both since 1998, and it reached 2,303.5 for males (an increase of 261.5 points from the previous year) and 1,096.2 for females (an increase of 131.7 points)in 2000. The damage rate for male victims has been 2.1 to 2.2 times that for female victims since 1991. Fig. II-26 Trends in the number of victims of penal code offenses and the damage rate, by gender (1991-2000) |