| Previous Next Index Image Index Year Selection | |
|
|
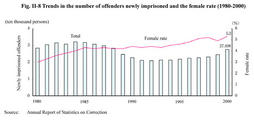
2. Trends in the number of new inmates (excluding inmates awaiting trial) Fig. II-8 shows the trends in the number of offenders newly imprisoned since 1980 and the female rate (the rate of females to all new inmates) (see Appendix II-6 ).
Fig. II-8 Trends in the number of offenders newly imprisoned and the female rate (1980-2000) The number of offenders newly imprisoned in 2000 increased by 3,002 (12.3%) from the previous year to 27,498. |
