| Previous Next Index Image Index Year Selection | |
|
|
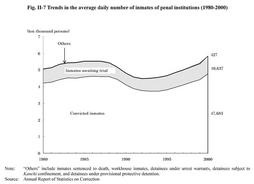
1. Trends in the average daily number of inmates, etc. Fig. II-7 shows the trends in the average daily number of inmates of penal institutions since 1980 (see Appendix II-5 ).
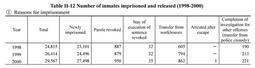
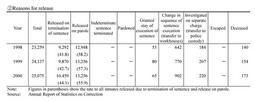
Fig. II-7 Trends in the average daily number of inmates of penal institutions (1980-2000) Table II-12 Number of inmates imprisoned and released (1998-2000) |