| Previous Next Index Image Index Year Selection | |
|
|
Fig. II-3 shows the percent distribution of the number of persons finally disposed by public prosecutors offices in 2000.
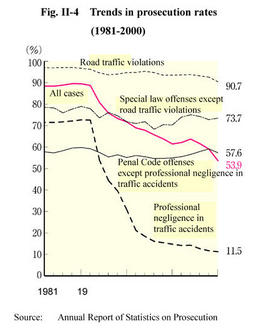
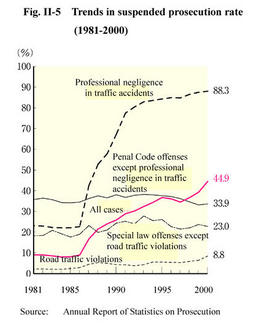
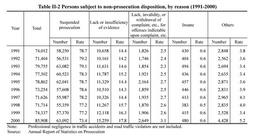
In 2000, 122,805 persons (5.6% of the total) were prosecuted for formal trials, 912,377 (41.8%) were prosecuted for summary orders, 842,106 (38.6%) were granted suspension of prosecution, 42,594 (2.0%) were not prosecuted for other reasons, and 261,591 (12.0%) were referred to family courts ( Appendix II-1 ). The prosecution rate was 53.9% (down by 5.4 points from the previous year) and the suspended prosecution rate was 44.9% (up by 5.3 points from the previous year) of all cases in 2000 (see Appendix II-3 ). Fig. II-4 and Fig. II-5 show the trends in the prosecution rate and the suspended prosecution rate over the last twenty years from 1981, by type of offense. Since 1987, the prosecution rate of professional negligence in traffic accidents has been decreasing (see Part IV) while with respect to penal code offenses other than professional negligence in traffic accidents, the prosecution rate and the suspended prosecution rate have been around 50% and 30% respectively (see Appendix II-3 ). Fig. II-4 Trends in prosecution rates(1981-2000) Fig. II-5 Trends in suspended prosecution rate(1981-2000) Table II-2 Persons subject to non-prosecution disposition, by reason (1991-2000) |