| Previous Next Index Image Index Year Selection | |
|
|
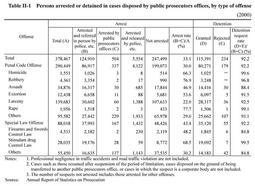
Table II-1 shows arrest and detention of suspects in cases disposed by public prosecutors offices, excluding cases of professional negligence in traffic accidents and road traffic violations in 2000, by type of offense.
The percentage of arrested suspects, that is, that of suspects who were arrested by the police, etc. and referred to public prosecutors offices in person and of suspects who were arrested by public prosecutors offices in the total suspects (arrest rate) was 33.1%. The percentage of suspects who were subject to detention requests from public prosecutors in the total arrested suspects (detention request rate) was 92.2%. Judges rejected detention requests for 0.2% of the suspects who were subject to such requests. Table II-1 Persons arrested or detained in cases disposed by public prosecutors offices, by type of offense (2000) |
