| Previous Next Index Image Index Year Selection | |
|
|
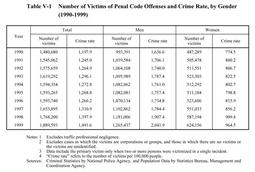
Table V-1 shows the number of male and female victims of penal code offenses(excluding traffic professional negligence, for the purpose of this Section)recognized by the police and the crime rate(number of victims per100,000people)in the10-year period from1990. The data only cover cases in which individuals were victimized.
The number of victims had remained on a par for both sexes in recent years, but started to increase in1996for women and in1997for men. The crime rate had remained within the range of1,700for men and800for women since 1991. In1998,however, the rate exceeded1,900for men and900for women. In1999,it rose further by134.5points for men(exceeding2,000)and by55.1points for women. Since 1990,the rate for men has been2.1to2.2times as high as that for women. Table V-1 Number of Victims of Penal Code Offenses and Crime Rate, by Gender(1990-1999) |