| Previous Next Index Image Index Year Selection | |
|
|
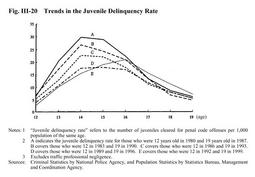
6 Trends in the juvenile delinquency rate Fig. III-20 shows how the juvenile delinquency rate of a given generation changes as the juveniles grow up. The horizontal axis indicates the age(12-19)of juveniles who were12years old in1980,1983,1986,1989and1992. The vertical axis indicates the juvenile delinquency rate for each cohort. In every cohort, the rate peaks between the ages of14and16,and declines from the ages of17through19. The delinquency rate was highest at age14for those who were12years old in1980,1983and1986. As for those who were12in1989and1992,the rate was highest at age15and16respectively.
Fig. III-20 Trends in the Juvenile Delinquency Rate |
