| Previous Next Index Image Index Year Selection | |
|
|
2 Drug offenses Fig. III-10 shows the number of juveniles referred by the police as well as the juvenile ratio(ratio of juveniles to the total number of persons received)for Poisonous and Deleterious Substances Control Law violations since 1972, the year when a partial amendment to the law criminalized the act of abusing thinner and other organic solvents or selling such substances in the knowledge that they will be abused.
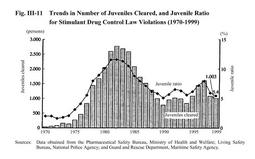
The number of juveniles referred for violations of the law peaked at 29,254 in 1982 and subsequently remained within the 20,000 range. It has, however, declined since 1991 and stood at 5,279 in 1999, almost one-sixth of the record high. The juvenile ratio remained high at over 80% from 1983 to 1992, but has stayed below 70% in recent years. In 1999, it stood at 68.8%. Fig. III-10 Trends in Number of Juveniles Referred by Police, and Juvenile Ratio for Poisonous and Deleterious Substances Control Law Violations (1972-1999) Juveniles cleared for Stimulant Drug Control Law violations decreased after peaking at 2,769 in 1982. The number began to increase in 1995, only to turn down again in 1998. In 1999, it fell by 76 (7.0%) from the previous year to 1,003. Fig. III-11 Trends in Number of Juveniles Cleared, and Juvenile Ratio for Stimulant Drug Control Law Violations (1970-1999) |