| Previous Next Index Image Index Year Selection | |
|
|
2 Administration of parole (1)Number of parole applications received
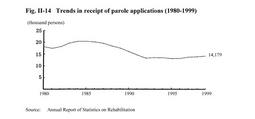
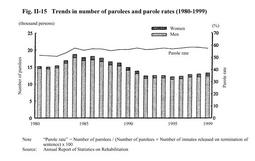
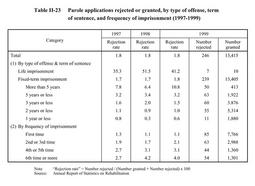
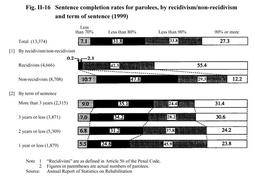
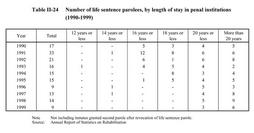
Fig. II-14 shows the number of inmates for whom parole applications have been received since 1980 (see Appendix II-11 ). The number of parole applications received had been steady at around 13,000 inmates since 1992, but in 1999 the number increased by 269 (1.9%) from the previous year to 14,179. In recent years, meanwhile, no applications have been received for provisional release from penal detention, detention in work houses, or women's guidance homes. Fig. II-14 Trends in receipt of parole applications (1980-1999) (2)Number of parolees and parole rate Fig. II-15 shows the number of parolees and parole rates since 1980. In 1999, the number of parolees increased by 308 from the previous year to 13,256. The parole rate, meanwhile, has been steady at more than 56% since 1989, falling by 0.9 points from the previous year to 57.3% in 1999. Fig. II-15 Trends in number of parolees and parole rates (1980-1999) (3)Parole application rejection rate Table II-23 shows the rejection rate for parole applications over the last 3 years, by type of offense, etc. The rejection rate in 1999 was less than 4.0% in all cases except inmates serving life sentences (41.2%) and determinate sentences of more than 5 years (10.8%). Table II-23 Parole applications rejected or granted, by type of offense, term of sentence, and frequency of imprisonment (1997-1999) (4)Sentence completion rates for parolees, etc. Fig. II-16 shows sentence completion rates(the proportion of the original sentence actually served until discharge on parole)for inmates granted parole in 1999 (except inmates serving indeterminate or life sentences), by recidivism/non-recidivism and term of sentence. Comparing recidivists and non-recidivists(that is, offenders with and without previous convictions), the latter have a lower sentence completion rate. Fig. II-16 Sentence completion rates for parolees, by recidivism/non-recidivism and term of sentence (1999) Table II-24 Number of life sentence parolees, by length of stay in penal institutions (1990-1999) (5)Community adjustment in the planned place of next abode Probation offices carry out community adjustment to help offenders detained in correctional institutions make a smooth return to society. This involves continuously coordinating with family members and other guarantors as soon as the offender's custody starts, and preparing an environment most conducive to the offender's return to society. The course and result of community adjustment is used as a material for parole examinations and correctional treatment by the Regional Parole Board and the correctional institution in which the offender is housed. In 1999, community adjustment was newly carried out for a total of 39,306 offenders, consisting of 32,891 inmates and 6,415 juvenile training school detainees. As of December 31st, 1999, community adjustment is currently being carried out for a combined total of 45,240 offenders(inmates plus juvenile training school detainees)(source:Annual Report of Statistics on Rehabilitation). |