Section 2 Treatment
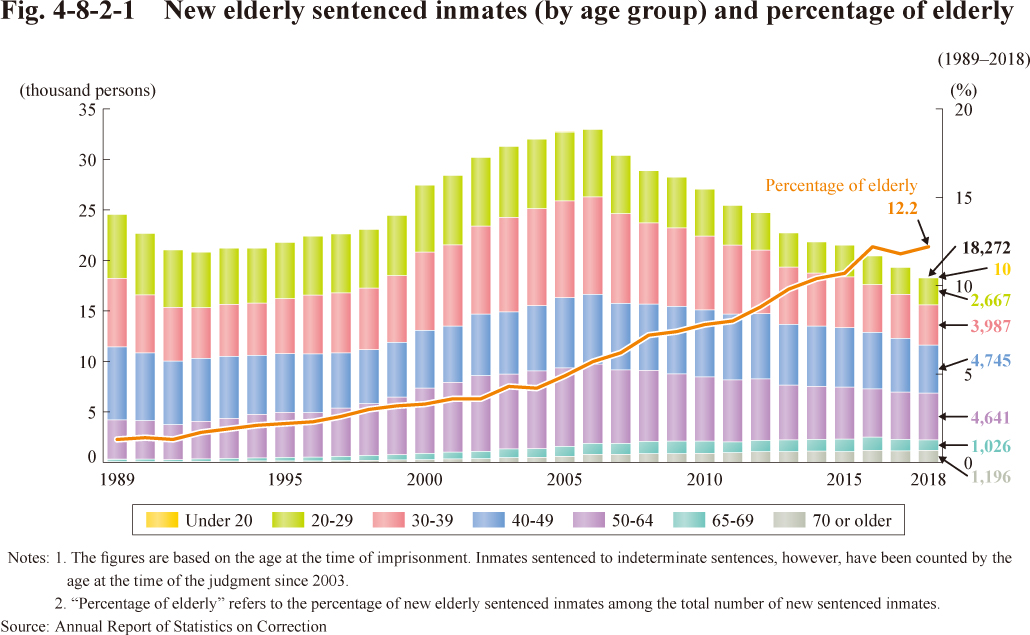
Fig. 4-8-2-1 shows the trend in new sentenced inmates by age group and the percentage of new elderly sentenced inmates among the total number of new sentenced inmates.
Fig. 4-8-2-1 New elderly sentenced inmates (by age group) and percentage of elderly