Section 2 Imprisonment of Elderly Offenders
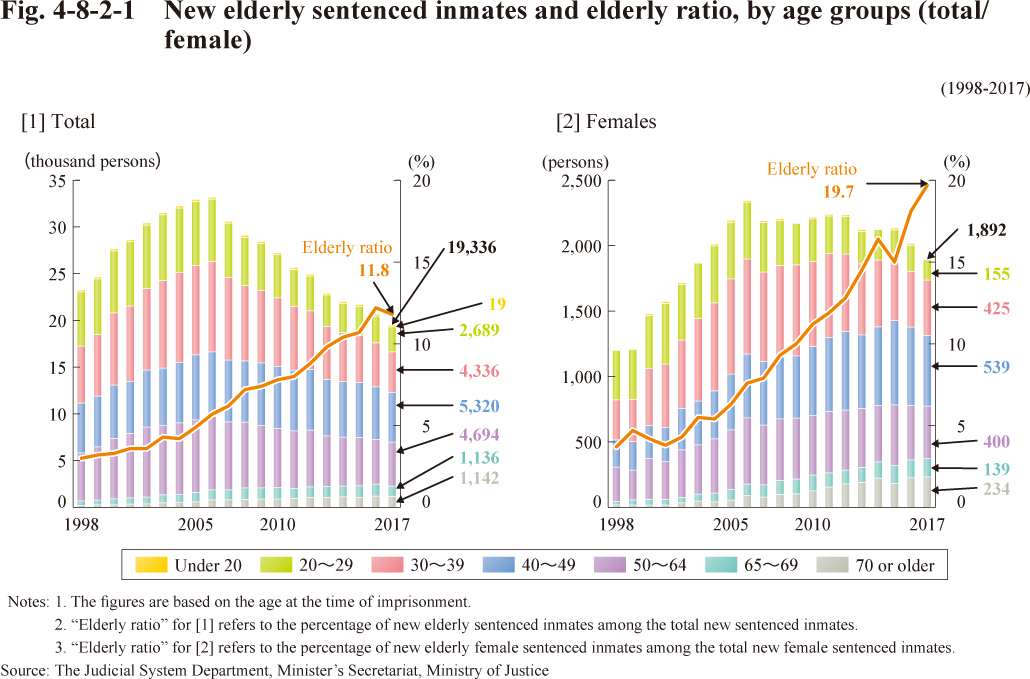
Fig. 4-8-2-1 shows the trend of new sentenced inmates by age groups and ratio of the new elderly sentenced inmates among total new sentenced inmates, by total/female population.
Fig. 4-8-2-1 New elderly sentenced inmates and elderly ratio, by age groups (total/female)