4 Redisposition of juvenile probationers/parolees
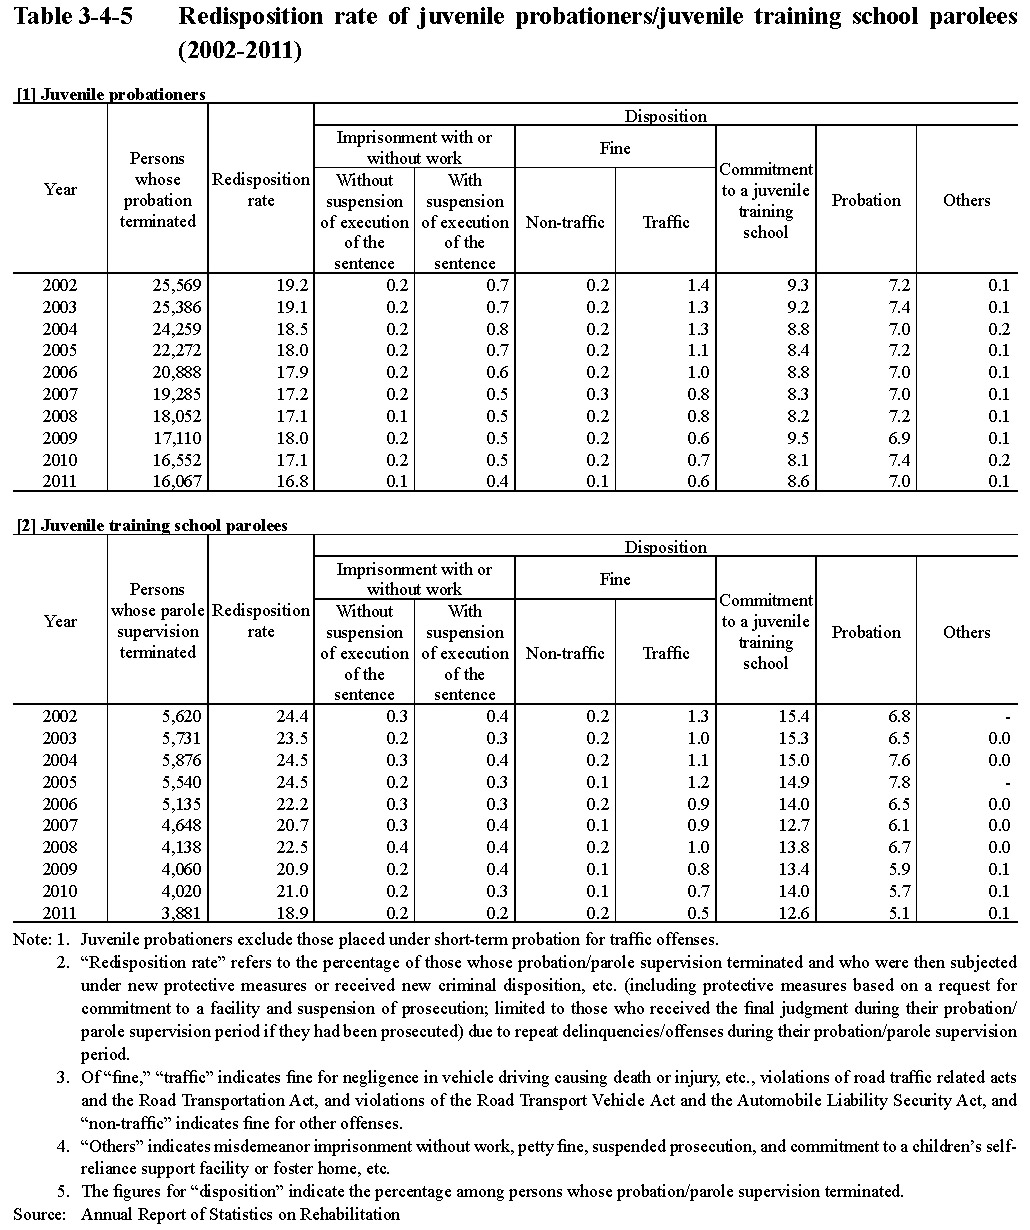
Table 3-4-5 shows the percentage of juvenile probationers/juvenile training school parolees whose probation/parole supervision terminated within the period of 2002 to 2011 but who were then subjected under new protective measures or received new criminal punishment, etc. (including protective measures based on a request for commitment to a facility and suspension of prosecution; limited to those who received the final judgment during their probation/parole supervision period if they had been prosecuted) due to repeat delinquencies/offenses during their probation/parole supervision period (hereinafter referred to as the “redisposition rate” in this subsection). The redisposition rate in 2011 was the lowest in the last 10 years with both juvenile probationers and juvenile training school parolees.
Table 3-4-5 Redisposition rate of juvenile probationers/juvenile training school parolees (2002-2011)
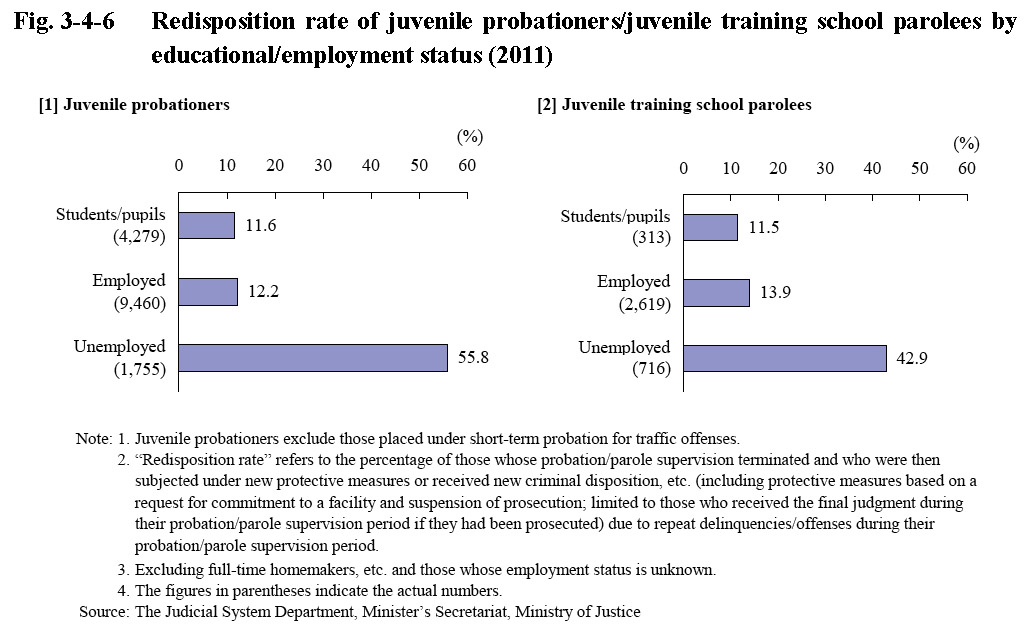
Next, Fig. 3-4-6 shows the redisposition rate of juvenile probationers/juvenile training school parolees whose probation/parole supervision terminated in 2011 by educational/employment status. With both juvenile probationers and juvenile training school parolees, the redisposition rate was remarkably higher with those who were unemployed than with those who were employed or were students/pupils.
Fig. 3-4-6 Redisposition rate of juvenile probationers/juvenile training school parolees by educational/employment status (2011)