Section 2 Arrest and Detention of Suspects
Table 2-2-2-1 shows the number of persons arrested or detained for cases disposed by public prosecutors (limited to non-traffic penal code offenses and special act offenses excluding violations of road traffic related acts but including juvenile cases) by type of offense in 2011.
The percentage of suspects physically restrained (suspects who were arrested by the police, etc. and referred to public prosecutors without being released or arrested at public prosecutors offices) to all suspects but excluding juridical persons (custody rate) was 31.1%. In addition, the rate of detention requests (percentage of suspects whom public prosecutors requested to detain among all suspects physically restrained) was 93.1%.
Table 2-2-2-1 Number of persons arrested or detained in cases disposed by public prosecutors by type of offense (2011)
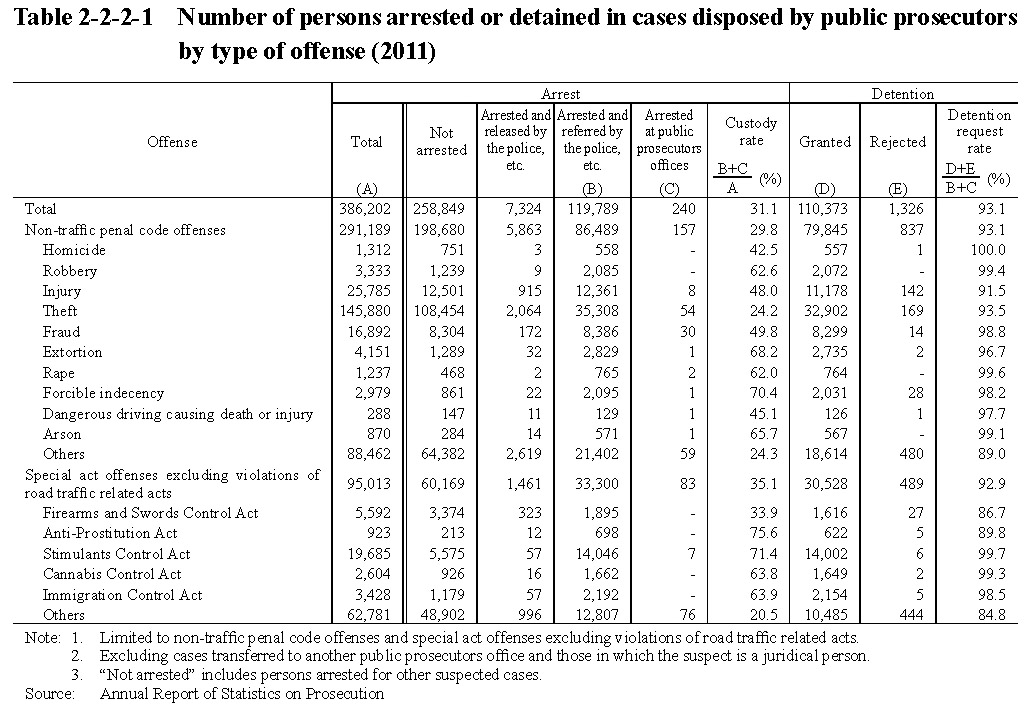
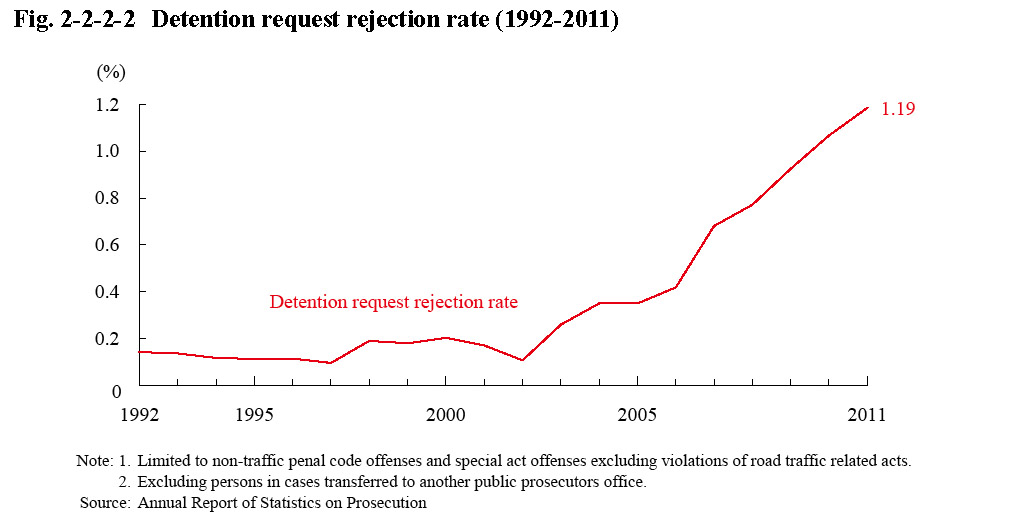
Fig. 2-2-2-2 shows the detention request rejection rate (percentage of suspects requested to be detained but rejected among all the suspects requested to be detained) over the last 20 years. It was on a rising trend from 2003.
Fig. 2-2-2-2 Detention request rejection rate (1992-2011)