Chapter 3 Various Types of Offenses
Section 1 Traffic Offenses
1 Trends in traffic offenses
(1) Occurrence of traffic accidents
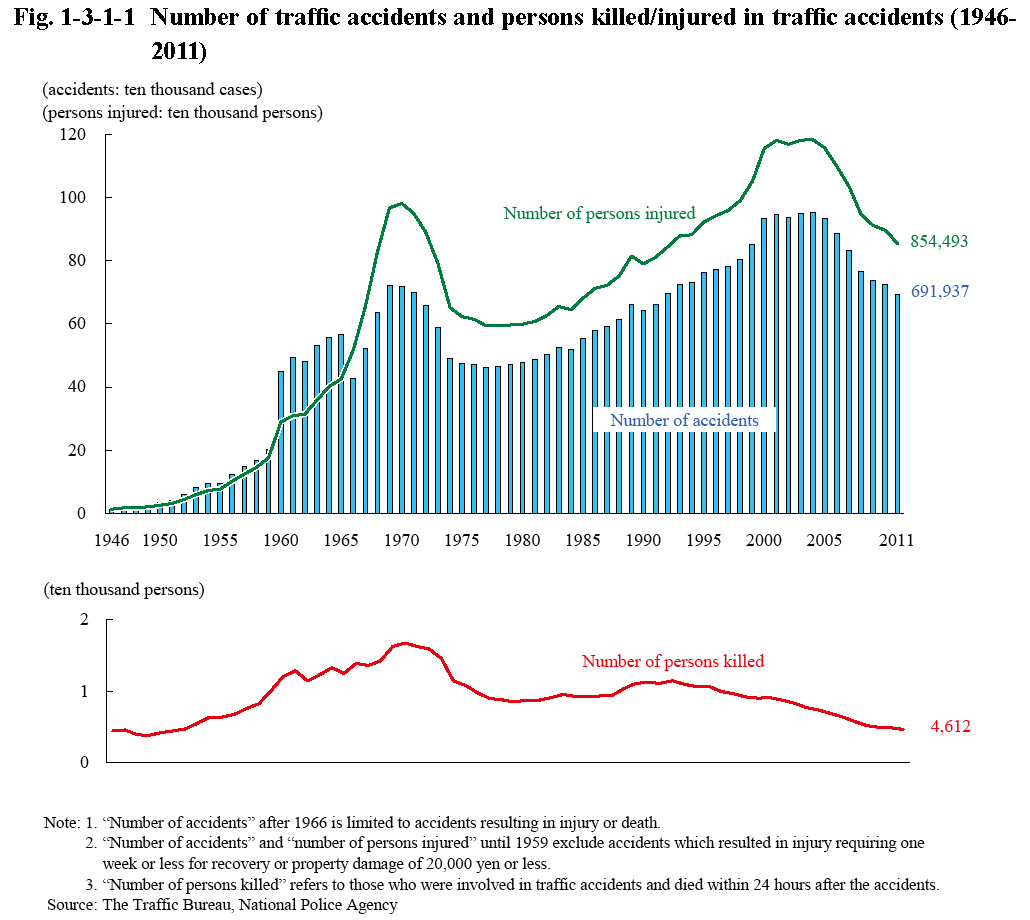
Fig. 1-3-1-1 shows the number of traffic accidents and the number of persons killed or injured in those accidents since 1946 (See Appendix 1-5 for details). The number of traffic accidents and number of persons injured in traffic accidents both remained at a high level from 2000 through to 2004, but then decreased for seven consecutive years from 2005. The number of persons killed was on a decreasing trend from 1993, and was 4,612 in 2011 (down 5.2% from the previous year).
Fig. 1-3-1-1 Number of traffic accidents and persons killed/injured in traffic accidents (1946-2011)
(2) Dangerous driving causing death or injury and negligence in vehicle driving causing death or injury, etc.
In 2011 the number of persons cleared for dangerous driving causing death or injury was 320 (down 4.8% from the previous year) and that for negligence in vehicle driving causing death or injury, etc. 680,117 (down 3.7% (id.)) (See Table 1-1-1-2). Of the above the number of persons cleared in cases involving death was 32 (up 3.2% (id.)) for dangerous driving causing death, 3,985 (down 0.4% (id.)) for negligence in vehicle driving causing death and negligence in the pursuit of social activities causing death, and 33 (up 13.8% (id.)) for causing death through negligence (including causing death through gross negligence) (Source: The Traffic Bureau, National Police Agency).
(3) Hit-and-run cases
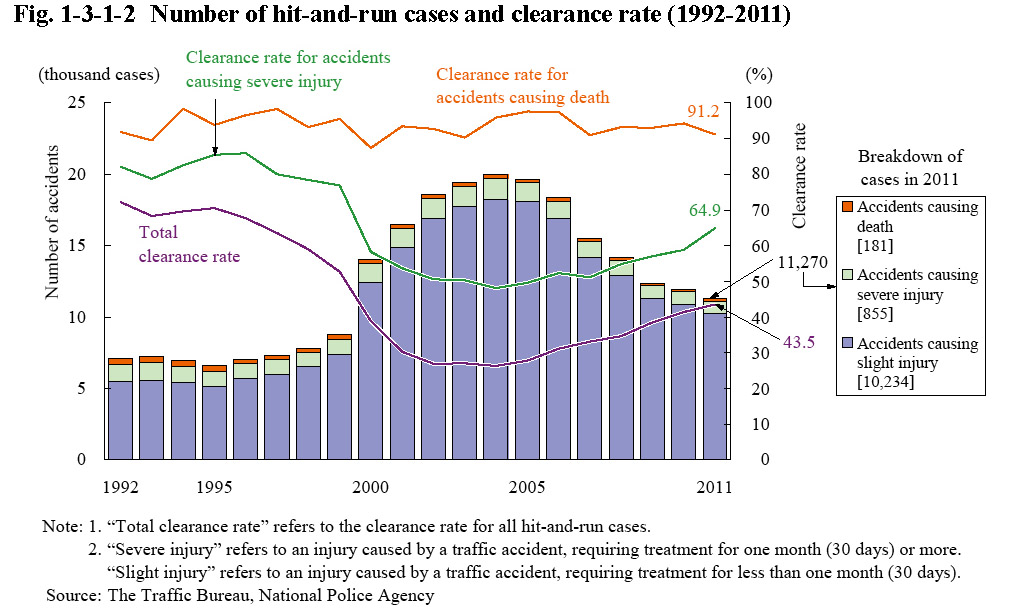
Fig. 1-3-1-2 shows the number of hit-and-run cases (cases of breach of the duty to provide first-aid in a road traffic accident on the road, thus causing death or injury) and the clearance rate since 1992. The number of cases sharply increased from 2000, but then decreased for seven consecutive years from 2005, and was 11,270 in 2011 (down 681 or 5.7% from the previous year). The clearance rate was on a declining trend from 1996, but then turned to follow a rising trend from 2005. Limiting the cases to those involving death revealed that the clearance rate generally remained at the high level of more than 90%.
Fig. 1-3-1-2 Number of hit-and-run cases and clearance rate (1992-2011)
(4) Violations of road traffic related acts
The number of processed cases for violations of road traffic related acts consisting of the total number of notified cases (refers to cases notified under the traffic infraction notification system as non-penal offenses; hereinafter the same in this subsection) and the number of referred cases (refers to cases referred as penal offenses; hereinafter the same in this subsection), remained within the range of eight to nine million from 2003 and was 7,854,570 in 2011 (down 2.4% from the previous year) (Source: The Traffic Bureau, National Police Agency).
The number of notified cases hit a minimum of 6,913,951 in 2002, but then started to increase. It reached 8,165,633 in 2005, but then slightly decreased, and was 7,416,021 in 2011 (down 2.1% from the previous year) (Source: The Traffic Bureau, National Police Agency).
Fig. 1-3-1-3 shows the number of referred cases over the last 20 years. The number reached 1,172,677 in 1992, and then remained at a level over one million. It then started decreasing sharply from 2000, and was 438,549 in 2011. By type of violation, driving under the influence of alcohol and excessive speed decreased from 2000 and 2002, respectively, while driving without a license was also slightly decreasing. Setting the number in 1992 as 100 revealed that in 2011 the index for driving under the influence of alcohol was 10.6, that of excessive speed 38.1, and that of driving without a license 24.8 (See Section 3, Chapter 2, Part 2 and Section 1, Chapter 3, Part 2).
Fig. 1-3-1-3 Number of referred cases for violations of road traffic related acts (1992-2011)
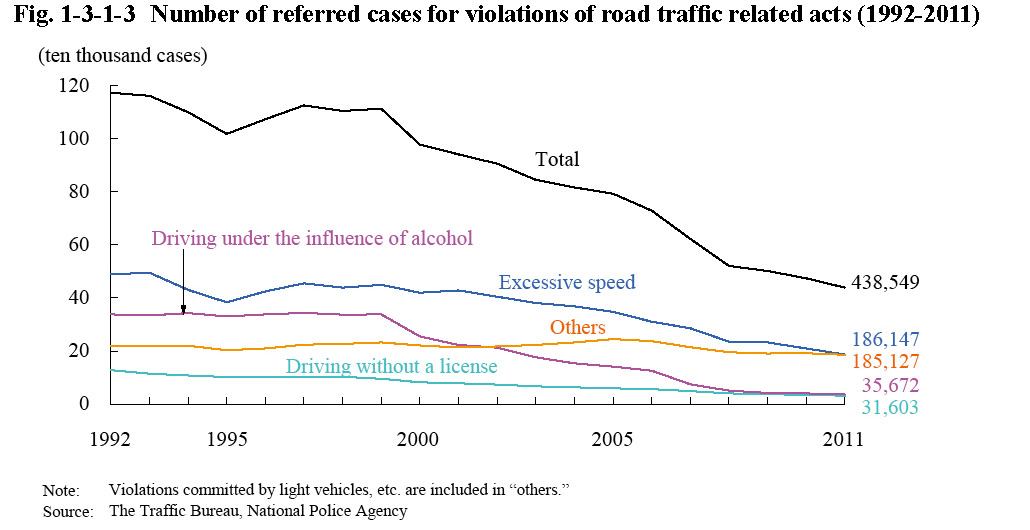
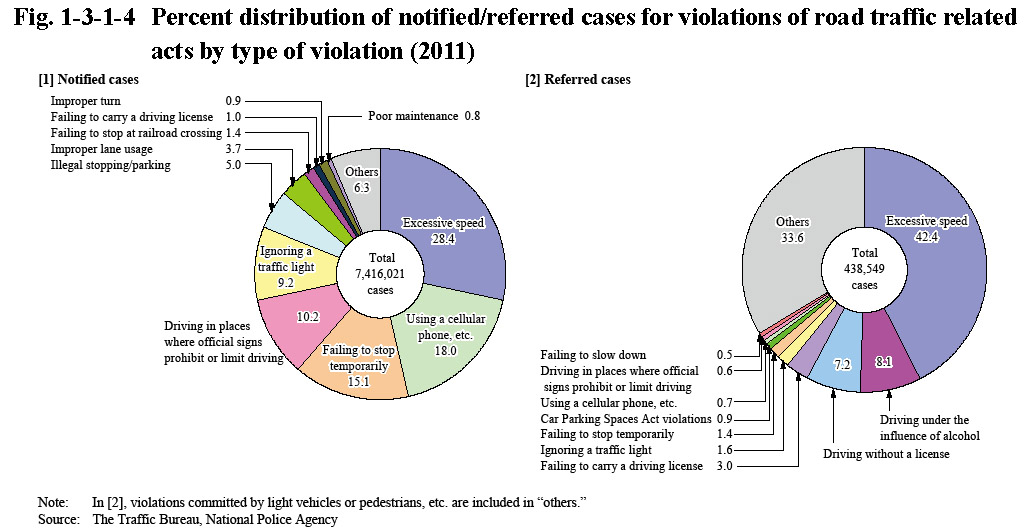
Fig. 1-3-1-4 shows the percent distribution of notified/referred cases for violations of road traffic related acts by type of violation in 2011. Of notified cases, excessive speed accounted for the highest proportion at 28.4%. Of referred cases, excessive speed also accounted for the highest proportion at 42.4%, followed by driving under the influence of alcohol, and then driving without a license, and with those three types of violations accounting for approximately 58% of all the referred cases.
Fig. 1-3-1-4 Percent distribution of notified/referred cases for violations of road traffic related acts by type of violation (2011)