6 Employment rate
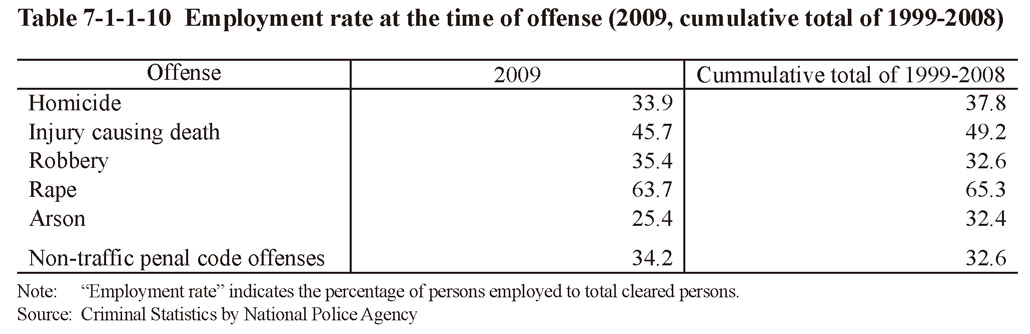
Table 7-1-1-10 shows the employment rate (percentage of persons employed at the time of the offense to total cleared persons) of persons cleared for serious offenses in 2009 and of those in 1999-2008 (cumulative total). The employment rate of persons cleared for homicide, robbery, and arson was at the same level as that for non-traffic penal code offenses, whereas that for injury causing death was higher and that for rape even significantly higher.
Table 7-1-1-10 Employment rate at the time of offense (2009, cumulative total of 1999-2008)